

Electricity Use and Conservation on Nantucket
| Sponsor: | Nantucket Energy Study Committee | |
| Sponsor Liaison: | Peter Morrison & Whitey Willauer | |
| Student Team: | Robert Alvarado, Corey Phillips, Joseph Taleb | |
| Abstract: | Using National Grid data for Nantucket, we constructed a baseline model of electricity use showing the diurnal, seasonal and annual consumption patterns for five municipal facilities, including the Solid Waste Treatment Facility, Waste Water Treatment Facility, Airport, High School, and Elementary School. In addition we conducted energy audits of five small businesses and identified several cost effective options to reduce electricity consumption. These results provide the Town’s Energy Studies Committee a scientific basis for formulating actionable plans energy reduction plans. | |
| Link: | Electricity_Use_and_Conservation_on_Nantucket
National Grid Data Analysis is available via the WPI Archive Page for this project. |
|
Executive Summary
Electricity consumption and expenditures have been rising in the US since the 1960s. Many programs and policies have been put in place at the state and federal level to conserve energy, but these have only slowed the rate of growth in consumption. Nantucket has suffered similar trends. In Nantucket there is a special concern about electricity use. As an island it receives all its electricity from the mainland via two submarine cables. As a result it pays some of the highest rates for electricity in the nation at 18.4cents/kw. Consequently, the Nantucket Energy Studies Committee is exploring various ways to reduce energy consumption in general and electricity use in particular.
The goal of this project was to assist the Nantucket Energy Study Committee in its effort to reduce energy costs on Nantucket. The project had three major objectives: 1) to create a baseline profile of the electricity use on Nantucket by analyzing detailed consumption data held by National Grid; 2) to characterize patterns of energy use among small businesses by performing energy audits; and, 3) to determine the impacts of a variety of conservation techniques to reduce energy among small businesses. Establishing a baseline model of energy use on Nantucket will help the Energy Studies Committee understand better how energy is being consumed on the island and therefore help them make more informed decisions about energy use strategies in the future. The energy audits of small businesses were intended to flesh out this picture of consumption a little more. Although the business sector makes up only a small fraction of the overall island consumption, we focused our audits here because we believe that if local businesses enact conservation strategies they can act as ‘catalysts’ for residents to follow.’
Analysis of the National Grid data clearly reveals the seasonal variation in electricity consumption. Figure 1 shows that the diurnal pattern of electricity for all four seasons is relatively similar. The steep rise in the morning coincides with most people waking up. The curve then proceeds to drop slightly in the afternoon, followed by a rise at dinner time, and finally a drop when people go to sleep. The electrical demand seen in the winter, spring, and fall seasons are all within 3MW of each other. Summer, however, sees a much larger demand. The summer peak is almost 9MW greater than the peak in the winter season and reflects the substantial increase in population at that time.
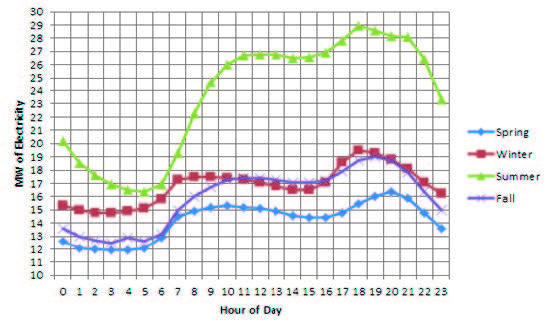
Figure 1 ‐ Nantucket Seasonal Demand 2010‐2011
In addition to island wide data, we also looked at the electricity consumption of several G3 and G2 facilities, including three G3 facilities (the Solid Waste Treatment Facility, the Waste Water Treatment Facility, and the Airport) and two G2 facilities (the High School and the Elementary School). The National Grid classifies large users as G3 and moderate users as G2 Figure 2 shows the total kW per day used by the Solid Waste facility in 2010. Overall usage throughout the year is relatively consistent although there is a slight increase in usage during the winter months. While the increased generation (and thus need for disposal) of trash in the summer would be expected to increase electricity consumption at the facility, it appears that the need for winter heating in the composter is a more significant factor. Heating in the building is circulated by large ventilation fans that draw a large amount of electricity and see an increased use during the winter months. The periodic downward spikes are probably related to scheduled or unscheduled maintenance on the composter.
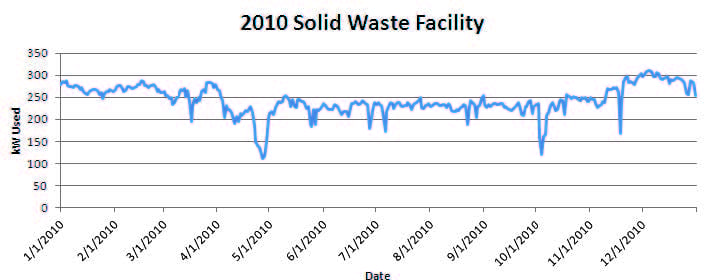
Figure 2 ‐ 2010 Solid Waste Treatment Facility Consumption
The Solid Waste Treatment Facility has experienced an increase in overall consumption since 2006 which is shown in Figure 3. The data show a slight decline in usage from 2005 to 2006, but a relatively steady annual increase between 2006 and 2009. Since 2009 usage has dropped somewhat which may reflect the impact of the recent recession on the generation of trash. This facility is the largest consumer on the island, and any decrease in usage can have a significant impact on the islands total consumption.
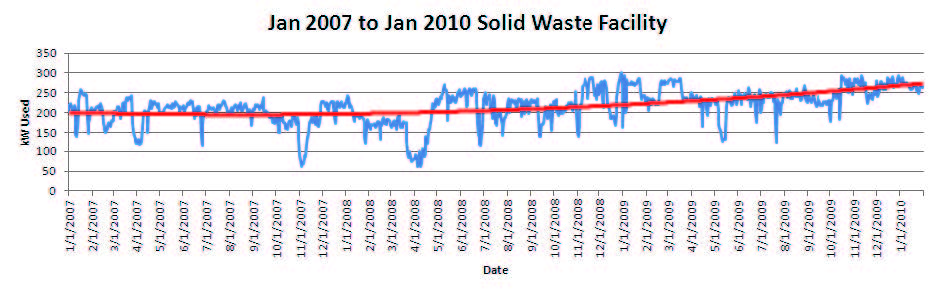
Figure 3 ‐ Jan 2007 to Jan 2010 Solid Waste Treatment Facility Consumption
Another G3 facility we analyzed was the Waste Water Treatment Plant. Figure 4 shows the average diurnal load in a day for the entire data range (January to October 2011). As we can see, the pattern of use throughout the day has an interesting characteristic. Between the hours of 12 AM and 4 AM, the general load varies roughly between 250 and 285 kW. This then starts to increase to a peak of 330 kW and stays in this range until around 6 PM where it slowly starts to drop back down to off peak hours. The green line shows the maximum load during the peak day for 2011, which occurred on July 5. The load reached a peak of 530 kW shortly before noon when it was nearly double than the average weekday or weekend load. These graphs illustrate the nature of the data and types of patterns we observed. The data and patterns for all five facilities are in more detail in the main report.
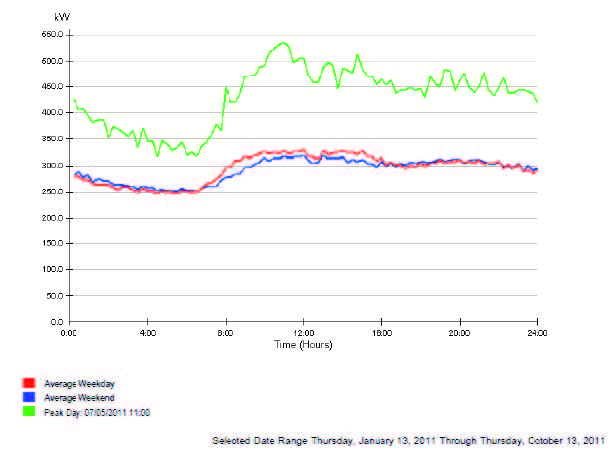
Figure 4 ‐ 2011 Waste Water Treatment Facility Consumption
To supplement our National Grid analysis, we conducted energy audits of select small businesses on the island in order to gain a better understanding of how this sector uses electricity. Figure 5 shows that energy consumption varies among the five businesses, but the seasonal pattern is as expected with a large spike during the summer when the population of Nantucket rises and a steep decline in the winter.

Figure 5 ‐ Business Electricity History
Based on the audit data, we found that the businesses could apply several simple conservation techniques in order to save thousands of dollars each year. Table 1 shows recommendations common to four of the businesses we audited and the savings associated with each. Each type of business shows a slightly different pattern of end-use, but lighting accounts for a substantial fraction of energy use in all of the establishments. Consequently, to compact fluorescent bulbs (CFLs) or light emitting diodes (LEDs) has the potential of saving each business more than $1000 each year. At this point, however, LEDs are still quite expensive, and the payback periods are substantially longer. The second major area of consumption is electronics devices (such as computers, printers and cash registers) especially in retail and office space. Thus, simply turning off electronics in the evening and on weekends, either manually or through timers, can result in substantial energy savings.
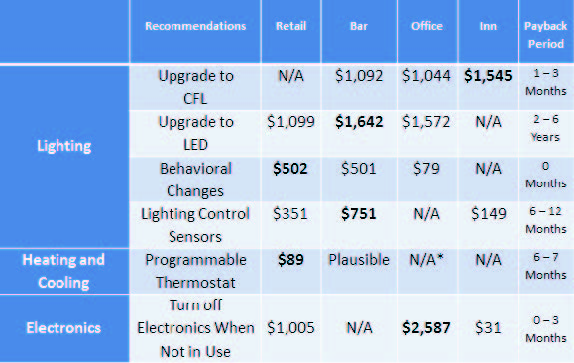
Table 1: Audit Savings
In conclusion we recommend the Nantucket Energy Studies Committee use the data obtained from both National Grid and from our energy audits to help support their efforts to reduce energy consumption and costs on the island. Having a better understanding of how these facilities use energy will lead to more informed decisions about the development of renewable energy or the installation management technologies such as smart grids. We also recommend the town promote energy conservation among both residential homes and commercial establishments as a means to drastically reduce overall consumption on island. Our relatively rudimentary energy audits revealed that by adopting simple energy conservation techniques, business owners can save large amounts of electricity and money. Techniques such as upgrading light bulbs, installing programmable thermostats, and turning off electronics at night are not just limited to commercial businesses. These techniques can be applied to residential homes as well and result in the same kinds of savings. By promoting energy conservation the town can delay the need for a third cable to supply the island with more electricity.