

Monitoring Nantucket Harbor
| Sponsor: | Town of Nantucket Natural Resources Department | |
| Sponsor Liaison: | Jeff Carlson, Natural Resources Coordinator Gregg Tivnan, Assistant Town Administrator |
|
| Student Team: | Hannah Brown, Daniel Dorfman, Allison Kenney, Daniel Mucaro | |
| Abstract: | Monitoring and maintaining the quality of Nantucket Harbor is the responsibility of the Nantucket Department of Natural Resources. The goal of this project was to compile all available data on water quality regarding Nantucket Harbor, make observations in trends regarding the harbor’s health, and make recommendations to better record and communicate information on water quality. This goal was met by analyzing nitrates and nitrogen inputs into the harbor and addressing the need for more detailed monitoring of water quality factors. | |
| Link: | Monitoring_Nantucket_Harbor_FINAL_REPORT | |
Executive Summary
Water pollution is one major problem that the island of Nantucket has had to face, particularly in recent years. Nantucket Harbor is vital to the economic and social well-being of the island – it is a source of shellfish and other seafood, it attracts tourists on the ferries, and its beaches are a major attraction for many of the island’s visitors.
Nitrogen is considered to be a limiting factor in water quality, and subsequently is the subject of many of Nantucket’s nutrient related studies (Curly, 2002). There are three major forms in which nitrogen occurs in aquatic systems. These forms are ammonia, nitrate, and various other organic compounds, with the focus of many testing sites on Nantucket being nitrate (Curly, 2002). Due to what is known as the nitrogen cycle, nitrogen in a healthy system will naturally occur in low quantities. As part of this cycle, nitrogen is converted by bacteria into forms usable by plants, which then utilize the nitrogen to make food through photosynthesis. When the plants die and decompose, the cycle can start anew, but problems can occur when the loading of nutrients such as nitrogen are added to a system faster than they can be integrated through these processes.
Nitrogen can be loaded into Nantucket Harbor by natural processes such as rainfall, the changing of tides, or the deposition of nitrogen from the atmosphere to water. The nitrogen loading over which people on the island have an influence include the surface runoff of nitrogen-rich fertilizer, faulty septic systems leeching into groundwater, and other agricultural additives that are washed through the island watershed into the harbor.
The Total Maximum Daily Load (TMDL) for total nitrogen is the amount of nitrogen in mg/L that can be released into the harbor that will not have adverse effects on the health of the harbor, and should be considered a threshold for which Nantucket needs to strive (Howes, 2009). In 2009, the Mass Estuaries Project determined that the TMDL for total nitrogen in Nantucket Harbor should be 0.35mg/L (Howes, 2009). In the same year, they also measured the nitrogen concentration in the harbor and determined it to be 0.34 – 0.41 mg/L at the head of the harbor, 0.34 mg/L at the Quaise Basin and 0.30 – 0.34 mg/L at the Town Basin (Howes, 2009). The nitrogen levels at each part of the harbor are either extremely close to or over the TMDL threshold. The harbor’s small ecosystem makes it sensitive to even the slightest nitrogen concentration changes so being even slightly over the TMDL is a threat to the health of the harbor (Howes, 2009).
During our initial research we planned to analyze all of the water quality data that was located at the Nantucket Department of Natural Resources. However, it soon became apparent that this was not possible to do within our time constraints. After consulting with Dr. Sarah Oktay, we decided to narrow our project scope, focusing on nitrates because they come from human sources and are therefore the most easily regulated source of nitrogen that flows into the harbor.
With this new direction we were able to gather the nitrate data through the Department of Natural Resources and organize it into quantitative data and contextual information. We then entered that data into spreadsheets and analyzed it to determine if there were any clear trends in the water quality in the harbor.
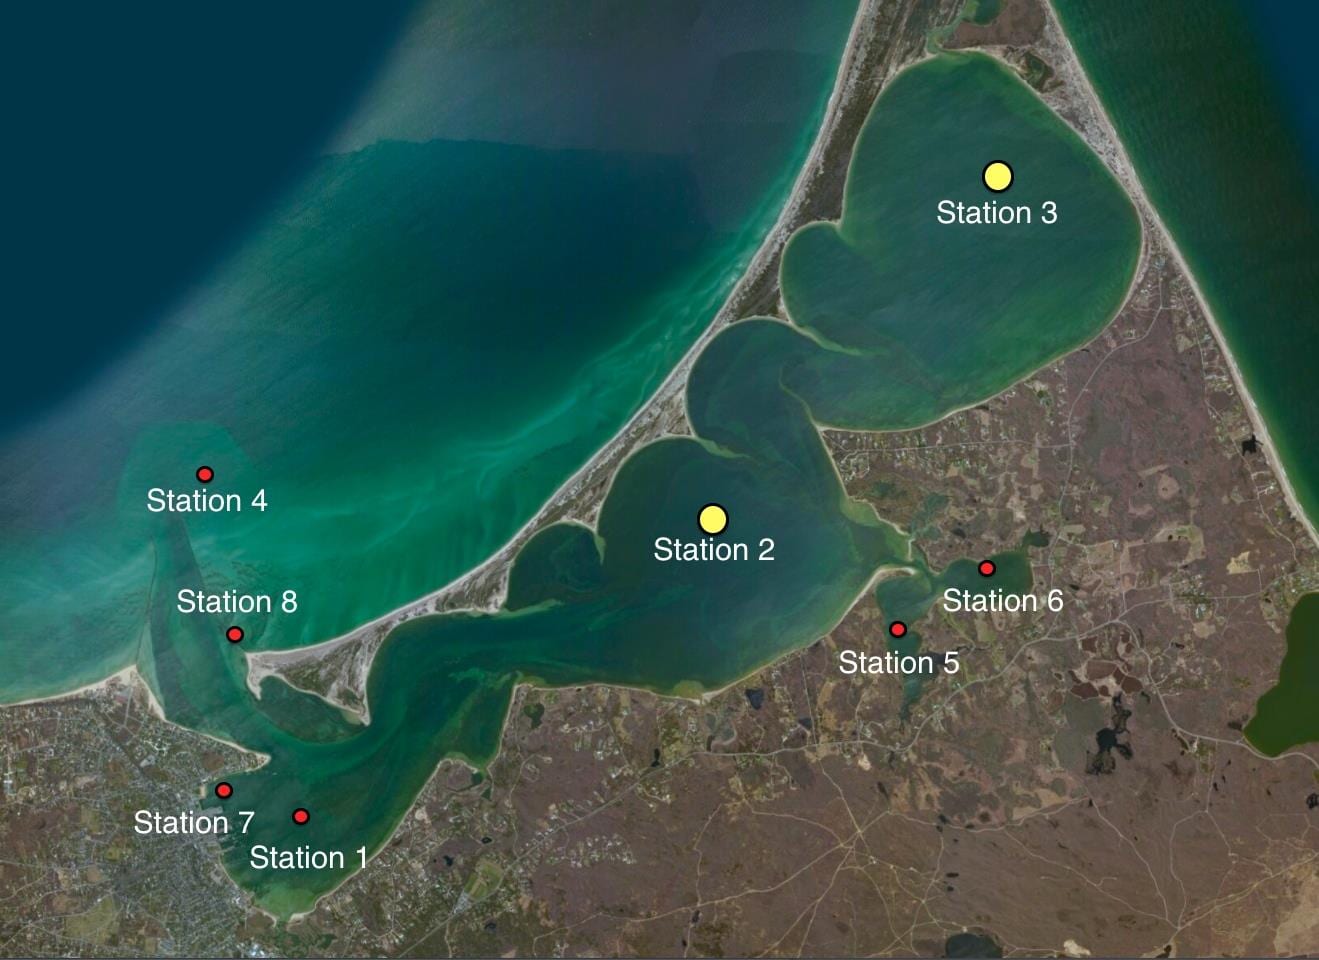
The first graph we made compared all 16 years of data that was collected at the eight different sampling stations around the harbor. Since the data was sparse and inconsistent, trends were hard to identify. 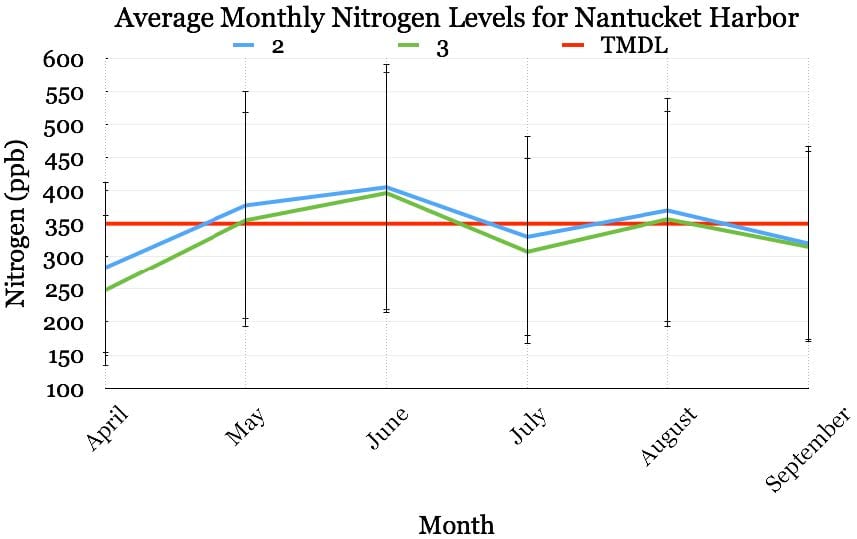 We then focused on stations 2 (Quaise Basin) and 3 (head of the harbor) because they have the slowest flushing rates, and therefore the most consistent data. Trends were easier to identify on this graph and showed fluctuations in nitrates during the spring and summer months. When the total nitrogen was compared at the same stations with the TMDL for the harbor, we observed that a peak in June greatly exceeded the TMDL. Next, we calculated the percentage of total nitrogen of which nitrates composed during June. We observed values of 6.6% for station 2 and 7.8% for station 3. By removing the percentage of total nitrogen that nitrates compose we saw that the value drops to a level that is very close to the TMDL for both stations. From the data we concluded that the TMDL could eventually be met in the harbor by reducing the amount of nitrates flowing into the harbor due to human influence.
Based on our analysis of the data we developed recommendations of how to continue monitoring and tracking the water quality trends in the harbor. One of our more important recommendations was to take water quality samples for analysis more frequently, and use more consistent sampling methods in order to show concentration data trends with higher resolution. To properly monitor the water quality, as well as the other bodies of water on Nantucket, we recommended that the town hire a full time employee to take these samples and analyze the data. Additionally, we recommended the Department of Natural Resources consider the use of several automatic water sampling buoy systems, which would enable continuous sampling and analysis. We also recommended a future study in which researchers observe just how much of the nitrate concentrations can be realistically reduced by human practices. Lastly, we recommended that the town ArcGIS database be continuously updated. Taken together, our recommendations will make it easier to help organize harbor quality data, as well as make this data easily accessible to both researchers and the public.