

An Interactive Whaling Map for the NHA
| Sponsor: | Nantucket Historical Association |  |
| Sponsor Liaison: | Amelia Holmes, James Russell | |
| Student Team: | Dyllan Cole, William Cross, Evan Hatton, Ryan Stebe | |
| Abstract: | The Nantucket Historical Association has been working to augment its in-person exhibits with digital content. We worked with the NHA to create an online interactive map of the voyage of Nantucket natives Charles and Susan Veeder aboard the whaleship Nauticon to be displayed on the website for the Nantucket Whaling Museum. We used the information from Susan Veeder’s journal of the voyage to plot the journey and mark key events we thought were of interest. We recommend that the NHA continue to test the interactive map and solicit feedback about the map from its members. | |
| Link: |
Report: Interactive Whaling Map B20 Report Presentation: Interactive Whaling Map B20 Presentation |
|
Executive Summary
The Nantucket Historical Association is dedicated to preserving Nantucket’s history
through engaging visitor experiences. For most of its history, the NHA has focused primarily on
physical exhibits, such as its Whaling Museum (History of the Whaling Museum) and tours of
historic properties around Nantucket. While the NHA wants to continue providing these kinds of
exhibits, the society also wants to move more towards creating interactive digital exhibits.
Since the 1970s and 80s, museums have shown a general shift towards using more
interactive exhibits (Stillwell, 2017). Museums are attempting to use these interactive exhibits to
increase visitor engagement (Hawkey, 2004), as many visitors now consider static, non-
interactive exhibits to be too passive and thus uninteresting (Adams & Missouri, 2002).
The Nantucket Historical Association already hosts its own suite of interactives to better
engage users in Nantucket’s history. Some of these exhibits are more static in design, such as an
exhibit on the NHA’s website that shows petitions for and against the desegregation of
Nantucket’s schools; this exhibit only allows visitors to view a summary of each petition and an
image of the original document. The NHA’s digital exhibit on the whaleship Edward Carey
provides more interactivity, as it provides users with a menu where they can view different
videos detailing parts of the Edward Carey’s voyages. Finally, the NHA also has an in-person
interactive located on a kiosk in their Whaling Museum, which allows users to follow the
voyages of different whaling ships and view key events along the ships’ journeys.
To help build their repertoire of digital interactive exhibits, the Nantucket Historical
Association tasked our team with building an interactive map of the four-year voyage of
Nantucket natives Charles and Susan Veeder aboard the whaleship Nauticon. Susan Veeder kept
a detailed journal of the voyage that the NHA had on file, and our goal was to use this journal to
map out the path of the voyage and mark interesting events along the way that we discovered in
Susan’s journal entries.
Historical Research and Data Collection
Our first task for this project was to extract data from Susan Veeder’s journal that we
would use to develop the map. The NHA helpfully provided us with a transcript of the journal,
and we took this journal and used it to create a spreadsheet of every journal entry, complete with
their date, original text, and geographic latitude/longitude coordinates for entries that included
them. Once we had compiled all the entries into this spreadsheet, we searched through them and
pulled the 40 entries that we thought would be most compelling to highlight on the map.
Mockups and Visual Design
Once finished with our data collection, we set about making mockups for how we wanted
the map program to look. Each of our group members individually drew up their own mockup;
once that was complete, we met to compare our individual mockups and design a master mockup
incorporating the features we thought were most compelling from each member’s design that we
would present to the NHA staff. Ultimately, our final mockup incorporated a map with the path
of the voyage drawn on to it with a line, with the various major events marked on it as dots.
Users would be able to click on each of these dots to bring up a popup with a description of the
event, which could be expanded to show the original journal entry as well. Users could also click
on the events on a timeline on the bottom of the screen. We also wanted users to be able to zoom
and pan the map to see more detail.

Development
We knew from the start that our program was meant to be a web application, so we
needed to decide how to develop it for the web. We eventually settled on using vanilla HTML,
CSS and JavaScript to develop our program, with the help of the libraries Materialize,
Animate.css, Fontawesome, and Mapbox.
Our program was designed to display the voyage’s path over a map of Earth, so naturally
we began our work by implementing the map that would be used as a background later. The
NHA provided us with a map image they had used in a previous interactive exhibit, which was a
Robinson projection map centered on the Pacific Ocean. We initially inserted the map as a
simple image that users could zoom in and out of with the mouse wheel or a zoom slider at the
top left of the screen, as well as pan by clicking and dragging the mouse.

One of the first problems we ran into with this solution was that the image was too low-
resolution, and thus looked blurry when a user zoomed in too far. We fixed this at first by
converting the image into an SVG (Scalable Vector Graphics) image that gave it much greater
visual fidelity, but this was a difficult and impractical solution that we later dropped in favor of
converting the program to use the library Mapbox. Mapbox is a mapping framework that allows
us to display a much more detailed and visually appealing map, complete with labels on
locations and bathymetric data.

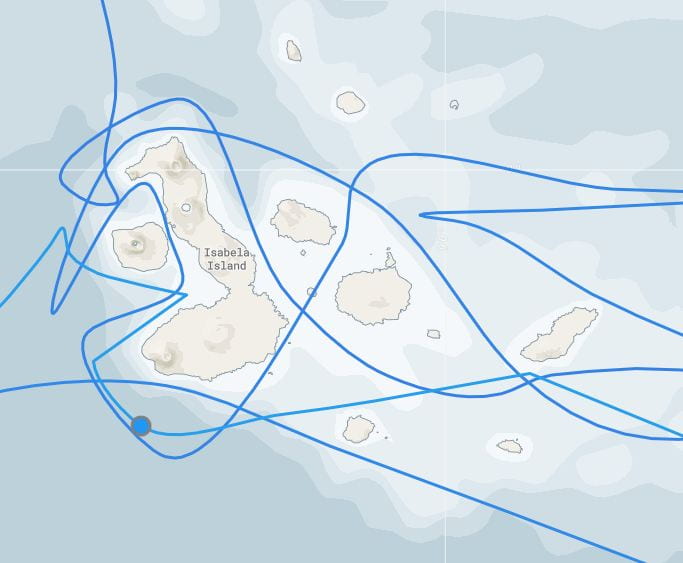
After the map itself, the second most important part of the program was laying out the
path of the voyage on the map. Susan Veeder’s journal, despite not being a full ships’ log, still
had many records of latitude and longitude coordinates along the voyage; however, since these
coordinates were not entirely complete, we used a Java program to estimate coordinates where
we had no data. We placed the known and estimated data into a JSON file that our program
would read in and use to draw lines between all the coordinates on an HTML canvas object. Our
initial path looked mostly as we wanted, but it still had issues. The path looked jagged since we
simply drew straight lines between the points, so we used Catmull-Rom splines to interpolate
curves between the points, thus making the path look notably smoother. Additionally, the path
was too low-resolution, making it look blurry when a user zoomed in too far. The switch to
Mapbox fixed this issue, as Mapbox has built in functions that we used to draw much higher-
resolution and detailed lines. Finally, the coordinates we had estimated occasionally were
incorrect, having issues such as running into land masses. The higher detail allowed by Mapbox
meant we could go in and edit the coordinates to move them to better estimates.
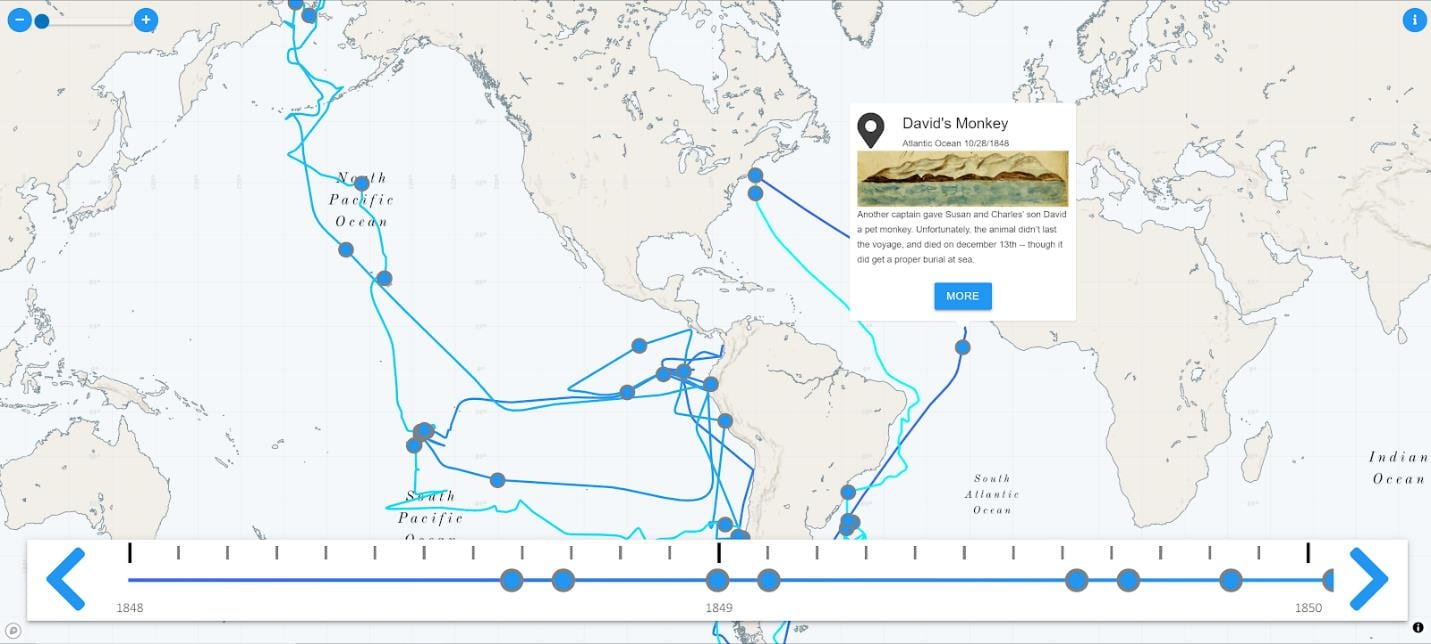
The last part of development, along with the map and path, was placing markers for our
chosen notable events and developing a system where users could click on the markers and bring
up a descriptive view of the event. We were able to implement this feature much as we had
wanted to in our mockup, with dots along the path that users could click on to show a small
popup, shown in ES5, with the event’s description that could then be expanded into a larger
window which included the journal entry associated with the event.
Further Extensibility
We initially planned to perform our own period of testing and quality assurance;
however, the Nantucket Historical Association decided to take over that role, as they wanted to
handle testing and feedback themselves. We designed our program to be extensible and easily
modifiable in the future, as our data files of coordinates and events can easily be added to.
Additionally, the NHA staff discussed possibly using our design as a platform for future exhibits,
so the design of our program allows a developer to easily replace our coordinates and events and
draw the path for a different vessel than the Nauticon used in our exhibit.