

Nantucket Buildout Analysis
| Sponsor: | Town Manager’s Office |  |
| Sponsor Liaison: | Rita Higgins, Gregg Tivnan, Andrew Vorce | |
| Student Team: | Jonathan Barr, Peter Durkin, James Heineman, David Simpson | |
| Abstract: |
The goal of this project was to perform a buildout analysis for the Town of Nantucket that could inform the Master Plan in 2020/2021. The analysis is based off current zoning, wetlands, and other land use criteria. To realize this goal, the team acquired the town’s assessor, GIS, and building permit data. This data was analyzed using Microsoft Excel and ArcGIS Pro. The tables, maps, and graphs produced from the data resulted in the current day depiction of residential dwellings and parcels and three different buildout scenarios: a hypothetical maximum residential buildout scenario, a high residential dwelling growth scenario for 2030, and a low residential dwelling growth scenario for 2030. |
|
| Link: | TMO_FinalReport-228ur7r NantucketBuildoutAnalysisPres-1z4m0sd |
|
Executive Summary
Introduction
A buildout analysis is a detailed study that projects the hypothetical number of future dwellings, subject to constraints. The analysis serves as a foundation for a Master Plan, a decade-long community development plan that can be used to project different town needs including sewerage, electricity, affordable housing, population growth, school class size expectation, other town services and needs.
This buildout analysis only explored the buildout of residentially zoned parcels, as these parcels represent the majority of future Nantucket housing developments. A brief computation on development in commercial zones is included in the full report, but was not the primary focus of the analysis. All of the data obtained for this project came from town databases and is current as of September, 2018.
Mission Statement
The purpose of this project was to perform a buildout analysis for the Town of Nantucket to estimate the island’s future residential dwelling growth and provide a tool that can be used to analyze the town’s infrastructural needs. The buildout analysis was conducted by determining the number of current residential dwellings, creating a hypothetical maximum scenario, and then projecting both high and low dwelling growth scenarios for 2030.
Methods
- Present Day Nantucket
- Parcel data collection from GIS, assessor’s office
- Divide residential dwellings into different island districts
- Identify all parcels that already have one or more dwellings per parcel in residential zones
- Calculate dwellings/parcel to find the average number of dwellings per parcel
- Hypothetical Maximum Buildout Scenario
- Parcel Data collection from Assessor’s Office and GIS Coordinator
- Categorization of Parcel Data- which parcels are buildable and subdividable
- Clean Data to eliminate inconclusive data
- Data Analysis and Mapping
- 2030 High and Low Development Scenarios
- Parcel data collection from Planning Department
- Conduct focus group of experts to create hypothetical 2030 dwelling numbers scenarios
- Create a low and high dwelling growth scenario
- Tool for town planners
Results
The Master Buildout Analysis data in Table 1 first reveals Present Day (green) Nantucket by district, which is a snapshot of the current residential parcels and single/multi- dwelling parcels existing on Nantucket. These values provide the basis of comparison for the next section, Hypothetical Maximum Buildout (purple). This second section is the maximum buildout of residentially zoned parcels, broken down by total and district. These values are not a prediction; but instead provide an estimate the potential development capacity on the island. There are also associated uncertainties and assumptions that are discussed in the main report. The last two sections, Low and High Scenarios (yellow), present possible dwelling growth by 2030, the expected end of the community’s next Master Plan. Using building permit data, the projected Low and High Scenarios can be compared to both Present Day Nantucket and the Hypothetical Maximum in this table.

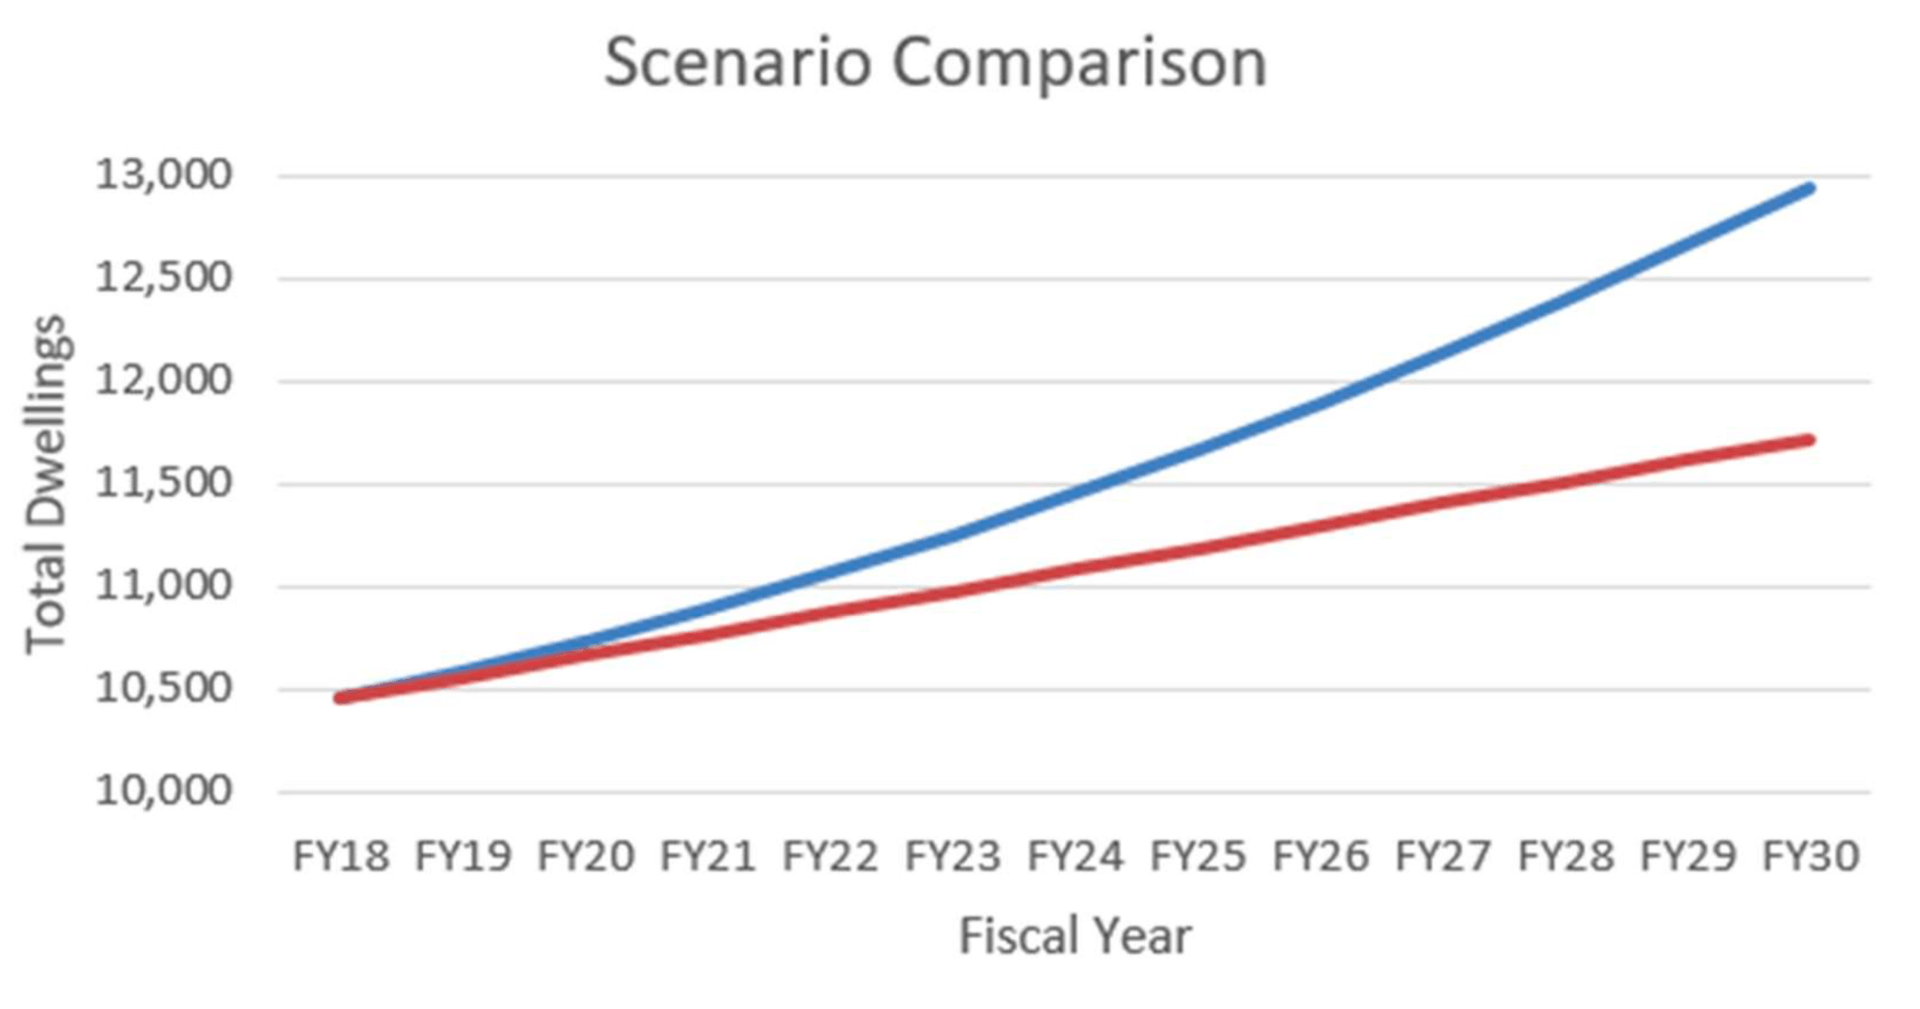
The Low Scenario was the average amount of single family dwelling permits from 2001 to 2018 subtracting average demolition, calculated to be 105 net new dwellings per year. The High Scenario is the linear trend of single family dwelling permits from 2015 to 2018, showing 13.6 new dwelling permits issued per year. This trend assumed that the current increasing rate of building permits issued would continue from now until 2030. Graph 1 illustrates the two scenarios.
Finding Statements
These finding statements illustrate the critical takeaways from the Buildout Analysis. The findings are broken down into Present Day Nantucket and three Hypothetical Buildout Scenarios.
Present Day Nantucket
- There are 10,456 dwellings on Nantucket currently
- There are 1.22 dwellings per residential parcel
- Town accounts for 40.9% of the total number of residential dwellingsHypothetical Maximum Buildout Scenario
There are three main types of parcels that could see new residential dwelling development. These parcel types are:
o Undeveloped: Parcel currently with no dwellings
o Secondary Dwelling Eligible: Parcel with 1 dwelling and ground cover for a second dwelling
o Subdividable: Parcel with land area and ground cover available
- Current zoning regulations may permit up to 5,461 new dwellings on the Island
- Town could fit 2,610 new dwellings in residential zones 2030 Low and High Development Scenarios
- “Low” growth would see 1260 new dwellings created by 2030
- “High” growth would see 2,484 new dwellings created by 2030
Recommendations
This project has potential to be the baseline for future IQP projects on Nantucket. Due to the time constraints of the project, the team was unable to look deeply into the different impact areas that our buildout could affect. There are three main recommendations stated below that are focused on advancing the use and effectiveness of the Buildout Analysis: the various applications of the analysis, the tools of the analysis that can be modified, and recommendations for further adjustments and updates for the information collected.
- Apply this Buildout Analysis to Nantucket Town services: This Analysis of hypothetical new dwellings could be used to project future Town needs such as electricity, affordable housing, potable water, etc.
- Use the Buildout Analysis as a tool: This Analysis has the ability to be updated and readjusted as seen fit for future uses. There are six different data sources that were used to create the Buildout Analysis. This data can be updated in order to ensure that the analysis is as accurate as possible for the Master Plan.
- Address uncertainties: Some uncertainties in this analysis are conserved areas, wetland boundaries, development of tertiary dwellings or other dwelling sources, geometric issues such as septic systems, wells, or leach fields, and more that are not mentioned here explicitly. We recommend that if the town performs a buildout analysis in the future, these uncertainties be taken into consideration and managed more thoroughly.