

Updating Nantucket’s GHG Inventory
| Sponsor: | Nantucket Energy Office |  |
| Sponsor Liaison: | Lauren Sinatra | |
| Student Team: | Brennan Aubuchon, Tyler Melo, Callan Moriarty, Jared Poulos | |
| Abstract: | In 2011, Nantucket developed a climate action plan, yet it was never adopted. Now the town seeks to create a more robust plan. Our project was to establish a baseline greenhouse gas inventory to set climate action goals and measure progress. We used the Metropolitan Area Planning Council inventory tool to estimate the island’s total annual greenhouse gas emissions, and found residential buildings and gasoline cars were the largest sources of emissions. Our survey revealed that the public favors electric vehicles and solar panels to reduce emissions from those sources. Based on our findings, we recommend climate action strategies the Nantucket Energy Office can pursue in the future and how the MAPC can improve the inventory tool. | |
| Link: |
Final Report: GHG Final Report Final Presentation: GHG Final Presentation Nantucket’s GHG Inventory: GHG Inventory |
|
Executive Summary
Many towns are concerned about the impact of their greenhouse gas (GHG) emissions on the global climate. For this reason many communities are creating climate action plans (CAPs) to mitigate their contributions to climate change. The first step in creating a CAP is often to develop a baseline GHG emissions inventory. These GHG inventories organize gasses by their source and sector to help show where improvements can be made. Over 10,000 cities around the world are joining together to fight climate change through action plans (Global Covenant of Mayors for Climate and Energy, 2020).
Nantucket’s Select Board voted to join the Cities for Climate Protection Campaign – a program led by the International Council for Local Environmental Initiatives (ICLEI) – in 2008. As part of the campaign, the town developed a baseline inventory of greenhouse gas emissions and outlined some emissions reduction strategies in the form of their own climate action plan. The plan faced criticism because it did not address the local conditions and specific challenges for Nantucket and was never officially adopted. The Nantucket Energy Office (NEO), founded in 2011, aims to create a new climate action plan more tailored to the local community. As the first step in formulating this plan, Nantucket must perform a revised and up-to-date GHG inventory to serve as a baseline to measure progress on emissions reduction in the future.
The goal of this project was to assist the NEO in developing a baseline inventory of Nantucket’s GHG emissions from residential, business, and municipal sectors. To achieve this goal, we identified five objectives:
- Review MAPC guidelines and usage in other communities;
- Determine how MAPC Protocol should be modified;
- Source pertinent data to create the baseline inventory;
- Gauge public opinion about GHG emissions and emission reduction strategies; and
- Analyze and interpret key findings revealed by the inventory and explore the most effective way to present them to the local officials and the public.
We developed the inventory following the MAPC guidelines and emissions inventory tools. We modified some elements of the protocols to ensure the inventory accounts for the special circumstances in Nantucket. Once we identified and obtained the data needed to complete the inventory, we cleaned it and used our modified version of the MAPC tools to create the baseline inventory. We summarized the key findings from the inventory and explored the most effective ways to present the findings to local officials and the public.
Data Analysis and Findings
Inventory Findings
Using the modified MAPC inventory tool, we were able to develop an effective baseline inventory and compile several conclusions regarding Nantucket’s greenhouse gas (GHG) emissions. Currently, the inventory tool calculates emissions from the following sectors: stationary energy, transportation, and waste using data from state databases as well as local sources from the town. As shown in Table ES1, the resulting calculations determined that Nantucket’s total GHG emissions equated to 141,484 metric tons of carbon dioxide equivalence (MT CO2e). The stationary energy sector was the largest contributor with 67.6% (95,700 MT CO2e) of emissions, followed by transportation making up 27.9% (39,527 MT CO2e) and finally waste with 4.4% (6,257 MT CO2e) as displayed in Figure ES1.
Table ES1: Community-wide Emissions Summary by Sector & Subsector
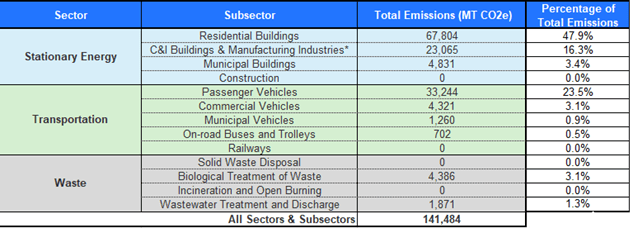
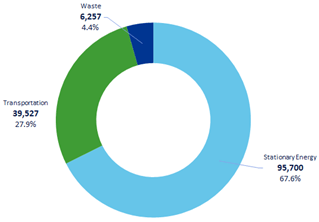
Figure ES1: Community-wide Emissions by Sector in MT CO2e
For stationary energy, it was evident that buildings were responsible for the majority of CO2e produced with the private sector being the dominant driver and municipal buildings having less of a significant impact as illustrated in Figure ES2. Upon further analysis, this was mainly attributed to high electricity and propane usage with electricity being 46% and propane comprising 36% of building emissions. This was mostly expected since propane is a popular heating fuel used on Nantucket. Overall, this sector poses a challenge for most communities in Massachusetts as it typically emerges as the largest source of emissions. This highlights a key opportunity area for communities like Nantucket who are looking to find ways to decrease their total emissions. Ultimately, the majority of improvements would need to be targeted towards residential and commercial buildings as they are the largest contributors.
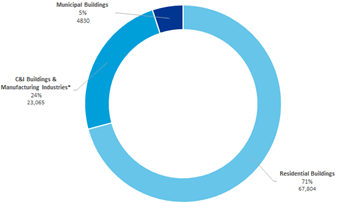
Figure ES2: Percentage of Stationary Energy Emissions by Subsector*
*Off-road included in the C&I Buildings & Manufacturing Industries subsector
The second largest contributor of emissions on the island was found to be transportation. The MAPC inventory tool splits this sector into emissions that result from different types of vehicles (passenger, commercial, municipal, etc.) and several types of fuels like gasoline and diesel. Based upon the results, passenger vehicles are by far the most prevalent emitters of transportation emissions making up 84% of the sector’s CO2e as shown in Figure ES3. This is likely a factor of passenger vehicles being the most common vehicle type registered with the town. This also correlates with gasoline being a substantial source of GHGs in the sector which accounted for 95% of all emissions. The inventories of Natick and Arlington also had similar findings within their transportation sectors.*Off-road included in the C&I Buildings & Manufacturing Industries subsector

Figure ES3: Transportation Emissions (MT CO2e) by Sector
The smallest proportion of the communities GHG emissions were attributed to the waste sector which includes emissions generated by the treatment of wastewater and the breakdown of solid waste. As shown in Figure ES4, the subcategory breakdown reveals that wastewater treatment accounts for 1,871 MT CO2e or about 30% of waste emissions, while solid waste disposal by composting accounts for the other 4,386 MT CO2e or around 70%. Compared to the inventories made by Natick and Arlington using the same protocols, Nantucket’s waste makes up a higher percentage. However, neither Arlington nor Natick reported any emissions from composting waste, so their subcategory data is not comparable. The differences in percentages and subcategories are most likely due to the differences in how these towns and Nantucket manage solid waste, especially since Nantucket’s waste management is unique amongst Massachusetts towns.
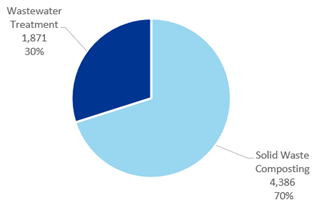
Figure ES4: Emissions (MT CO2e) by Waste Subcategory
Survey Findings
In coordination with the Nantucket Energy Office (NEO), we conducted a climate action planning survey for the residents of Nantucket to gauge their opinion on various emission mitigation strategies. The goal was to highlight initiatives supported by the public for the NEO to possibly pursue in the future. The questions included in the survey assessed what types of actions Nantucket should prioritize to help mitigate emissions, and allowed people to express their own personal thoughts on the current climate situation and how to address it.
The survey results indicate that most emission reduction strategies were supported by the majority of respondents. The measures that had more divided responses referred to a ‘pay as you throw’ system and transitioning to electric vehicles. In contrast, the initiatives that were highly supported included installing home solar, developing more island based renewables, electrifying public transport, and expanding bike and pedestrian infrastructure. In addition, Nantucketers expressed their support for adopting a Climate Emergency Declaration, as they are becoming increasingly concerned about the futures of their children and the island.
Recommendations
Based on the findings, the team came up with recommendations for the stationary energy, transportation, and waste sectors.
For the stationary energy sector we recommended that the town should prioritize convincing people to switch to renewable energy sources like solar panels and increase incentives for greener home heating/cooling systems like air source heat pumps. This is because 86% of stationary energy emissions come from private buildings which use large amounts of heating oil, propane, and other fossil fuels. Installation of home solar panels are also a popular option for going green based on the survey results.
In the transportation sector the team suggested the town further incentivize switching to electric cars and improve biking and pedestrian infrastructure. The town should consider this because 84% of transportation emissions come from passenger vehicles and reducing fuel emissions would have the most significant reduction in GHGs for this sector. Both of these options are also the ones most liked by Nantuckters according to the survey.
For the waste sector the town should offer home composting kits at little to no cost to the residents of Nantucket. It is the most popular option based on survey results and will reduce hauler trips and waste overall.