

Analyzing and Reporting Patent Quality Data
Authors
Brian McCarthy, Alex Riley, Evan Stelly, Alex Witkin
Sponsor
United States Patent and Trademark Office
Advisors
James Hanlan, Stephen McCauley
Term
October – December 2016
Project Outcomes
Abstract
Our team worked with the United States Patent and Trademark Office (USPTO) to improve the quality of patent examinations. We analyzed Master Review Form (MRF) responses to identify potential quality issues in order to recommend areas for further analysis. Based on interviews with managers regarding internal reporting, we also created a decision matrix to assist the Office of Patent Quality Assurance to implement an Ad Hoc analysis tool. Our recommendations will allow USPTO employees to utilize MRF data more effectively.
Executive Summary
The United States Patent and Trademark Office (USPTO) is essential to fostering the spirit of competitiveness and innovation across the country. On average, the USPTO examines 580,000 patent applications and processes 1.6 million office actions annually from various organizations and industries nationwide (USPTO, 2016c). Because of the number of organizations that depend on this system, it is important that patent examinations are conducted fairly and equally. In addition, when a patent application is rejected it can often lead to a lengthy and expensive appeal process. Therefore, it is vital that the patent examination process is as consistent and accurate as possible, rejecting applications only when necessary. Accordingly, the USPTO established the Office of Patent Quality Assurance (OPQA), an office within the USPTO which handles assessment, measurement and improvement of patent examination quality (USPTO, 2015a). Our project assisted the OPQA in improving the quality and consistency of patent reviews by identifying key trends underlying patent quality and mapping potential quality issues within the patent review process.
Background
In early 2015, the USPTO launched the Enhanced Patent Quality Initiative (EPQI) in order to improve the quality and consistency of the patent examination process (Camarota, 2016). As a part of this initiative, the OPQA created the Master Review Form (MRF), which measures the overall correctness and clarity of the work of patent examiners (Spyrou & Rater, 2016).
The MRF is broken down by what statute of patent law is being cited by the examiner as the reason for rejection. The most common statutes cited are 102 and 103. Statute 102 refers to prior art; if a claimed invention was patented or available to the public before the filing date, it will be rejected due to prior art (USPTO, 2015b). Statute 103 refers to non-obviousness; if a claimed invention is similar enough to previously patented work to be considered obvious “to a person having ordinary skill in the art to which the claimed invention pertains”, it will be rejected under statute 103 (USPTO, 2015c). Reviewers rate individual sections of the examination as either No Issues Found (OK), Needs Attention (AT), or Significantly Deficient (SD), for both the correctness and the clarity of the examiner’s work. In addition, each section contains a number of sub-questions which help identify exactly which portions of the examiner’s decision are not meeting the USPTO standards of quality (Spyrou & Rater, 2016).
Methods
To begin, we determined the needs of USPTO managers regarding the MRF data. In order to accomplish this, we conducted structured interviews with Quality Leads (QLs), Training Quality Assurance Specialists (TQASs) and Supervisory Patent Examiners (SPEs), utilizing a snowball sampling method to identify relevant interviewees in each category. We began interviews with QLs because they hold managerial positions and work closely with the MRF. Interviewees were questioned about what MRF data they would find most useful, and about various ways they would like to have the data presented to them. After each interview, responses taken from our written and audio notes and further analyzed to determine key patterns.
After determining employees’ MRF data needs, we analyzed the MRF data to find patterns related to the consistency and accuracy of patent examinations. We started our comparisons by looking at the overall clarity and correctness scores for each statute, as well of the specific sub-questions for these statutes. In addition, we filtered data by examiner grouping based on subject matter, referred to as Technology Centers (TC), as well as the Work Groups and Art Units that make up these TCs. This allowed us to determine whether there are patterns in correctness and clarity among groups of examiners.
Finally, we used the data we gathered throughout the interviews to identify the most popular models for reporting MRF data. The three reporting models that were discussed are Canned Reports, Snapshots, and Ad Hoc analysis. A Canned Report is a detailed, widely distributed report which focuses on data and analysis deemed to be most important. A Snapshot is a brief display of key data points that allows users to quickly gauge important information. Ad Hoc analysis allows the user to interactively examine trends and information they determine is most important. We then identified the advantages and disadvantages of each model based on interviewee responses. We organized these features, based on importance, by coding interviewee responses. This information was used to create a decision matrix to help guide implementation of the selected reporting method in order to help the OPQA meet the data reporting needs of USPTO managers.
Results
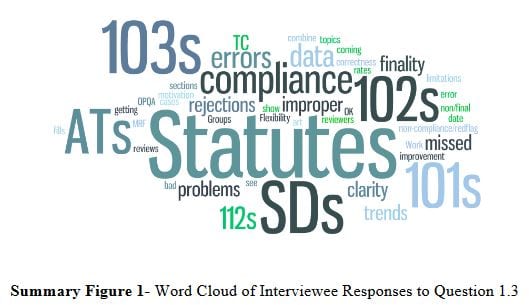
One of the first questions in our interview script (see Appendix A) asked employees about what information from the MRF would be most useful to them. Their responses were coded and displayed in the word cloud seen in Summary Figure 1. In this figure, terms appear larger based on the number of interviewees who mentioned the term. The word cloud shows that many employees were concerned with results based on statutes, specifically statutes 101 (usefulness), 102 (prior art) and 103 (obviousness). Also seen from the results, employees are most concerned with AT and SD rated examinations, which are examinations that had errors somewhere in the process. These examinations are also referred to as non-compliant.
We asked interviewees to rate the three reporting methods (Canned Reports, Snapshots and Ad Hoc analysis) on a scale of one to ten. On average, Canned Reports received a rating of 5.3, Snapshots received 6.3, and Ad Hoc analysis received 8.6. These results clearly show that Ad Hoc analysis is the most popular data reporting model among interviewees.
In addition, we collected employee opinions on the advantages and disadvantages of each model. In Summary Figure 2, we can see that employees identified customizability as the chief advantage of Ad Hoc analysis. Likewise, the employees’ major concern was that the chosen Ad Hoc tool would have a steep learning curve.

Our team organized the data collected by the MRF, then analyzed and drew conclusions from the information related to patent quality trends. While the MRF contains 395 questions concerning several different sections of patent law, we chose to focus on only the questions concerning statutes 102 (prior art) and 103 (obviousness) of the US Code, as the majority of reviews cited these statutes.
Our first analysis compared overall clarity to overall correctness. We looked at the percentage of total reviews that received the same rating in clarity and correctness, seen in Summary Table 1. Summing the percentages together, it can be seen that 85% of reviews received the same rating in both clarity and correctness, suggesting that there is a strong relationship between overall clarity and correctness.

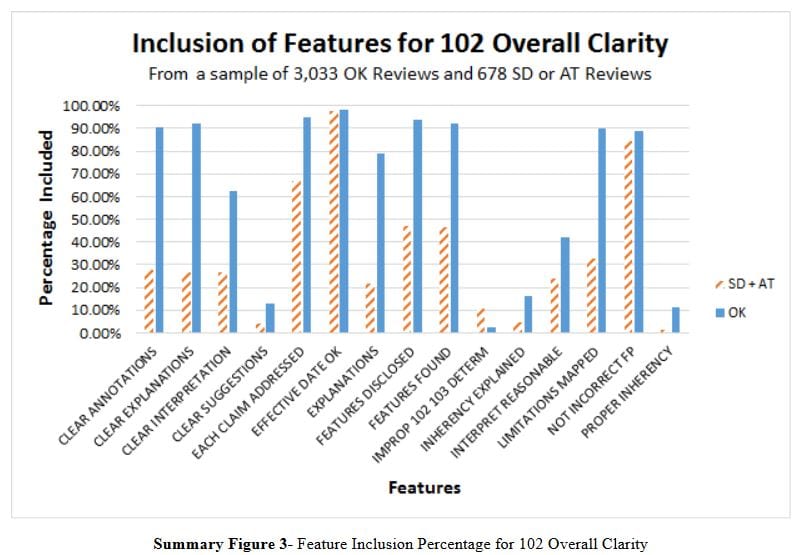
After comparing overall clarity and correctness scores, we examined whether the inclusion of specific features of an examination, such as clear explanations, affected that examination’s overall rating. We did this by graphing the percentage of examinations that received an OK rating in statute 102 (prior art) clarity that also included each of that statute’s features, compared to those that received an AT or SD rating in clarity that included that feature. This comparison can be seen in Sample Figure 3. By observing features that were included in most OK reviews but excluded from most SD and AT reviews, we can identify these features as driving the overall clarity for 102 (prior art). An example of this type of driver is clear annotations. Conversely, features that were included or excluded in the majority of all reviews, regardless of ranking, such as Effective Date OK, likely do not affect the overall clarity score or overall quality. This suggests that these questions could be removed from the MRF to save time and simplify the output, without affecting the overall results. These types of comparisons were also conducted for 102 correctness, as well as for 103 clarity and correctness as can be seen in Appendix C.
In addition to understanding trends for the entire USPTO, it was important to examine how different groups of examiners were performing. Specifically, we examined the overall correctness and clarity of reviews for 102 and 103 rejections for each TC (TC). By seeing how many of these reviews were rated as OK or AT/SD for each TC, we can quickly view which TCs have the most room for improvement and in which areas. The example in Summary Figure 4 below looks at TC performance for the clarity of statute 102. Using the sample size estimation equation we find that meaningful conclusions can only be drawn from groupings with a sample of 300 or more reviews.
Conclusions can only be made about TCs with a percentage of AT and SD reviews that is above or below a 95% confidence interval, indicated by the blue dotted line. A 95% confidence interval means that, if the results were recreated 100 times, it would be expected that a result would fall within this confidence range 95% of the time (Lane, n.d). Results outside this interval are considered statistically significant. TCs above this interval have statistically significantly more AT and SD reviews than other TCs and therefore may be the target of future training to improve quality concerning statute 102. In the future, further analysis can be done to analyze Work Groups and Art Units that make up any TC that could be having a problem with a given statute. Currently no conclusions can be made from looking at these groupings, because the sample sizes are too small to find statistically significant results.

Proposed Modeling for Reporting Needs
To assist the OPQA with identifying data reporting models that will meet the needs of USPTO managers, we created a Decision Matrix for Ad Hoc Analysis implementation, as seen in Summary Figure 5. The OPQA can use this Matrix to determine exactly what implementation of the Ad Hoc model will best fit the needs of USPTO employees. The categories, features, and weights were all chosen based on three main areas: the interview responses we collected, our discussions with USPTO liaisons, and our own experience with Ad Hoc tools like Microsoft Excel or Microsoft Analysis. Implementations of Ad Hoc analysis can be rated for each feature on a scale of 1-10; these scores are then multiplied by that feature’s weight to find the weighted score. Finally, the weighted scores are summed together to find the total score. The implementation which receives the highest total score is best suited to fit the needs of the USPTO.

Recommendation and Conclusions
Our project focused on performing a preliminary analysis on MRF data with a focus on statues 102 (prior art) and 103 (obviousness). We believe that this will provide a valuable basis from which the OPQA can complete more detailed and specific analysis of this data involving all 12 statutes cited by the MRF. There are many areas of the MRF where analysis could allow employees to improve the quality of patent examination. However, in order to understand the results, employees need the proper tools to generate and communicate results.
We offer the following recommendations:
- Utilize the decision matrix to implement a form of Ad Hoc analysis and distribute this implementation, integrated with MRF data, to USPTO employees
- Consider other forms of data reporting for MRF data, such as canned reports or snapshots, using interview responses to guide the design of these models
- Use MRF data to identify areas of USPTO experiencing quality difficulties
- Improve validity of MRF conclusions by examining the methods used for form sample selection
- Examine MRF data based on reviewers who complete the form to find and eliminate any potential biases that could skew results
- Reevaluate relevance of questions asked by MRF based on main drivers of quality, by focusing on questions regarded as drivers of quality while considering eliminating questions that are not seen as drivers of quality
Our project will allow OPQA employees to better interpret and utilize results they receive from the MRF. This will allow them to better identify and eliminate quality issues involved with the patent examination process. Effectively eliminating issues regarding patent quality will not only increase the reliability of examination results produced by the USPTO, but also improve the trust between the USPTO and the community of inventors and innovators whom they serve.