

New Methods in Understanding Visitor Experience: Evaluations of the Citi Money Gallery at the British Museum

SUMMARY
Introduction
The Citi Money Gallery in the British Museum is re-evaluated yearly in order to present the sponsor of the gallery, Citibank, with updates on their investment. Our IQP group set out to complete the required evaluation and use this opportunity to invent new methodologies and create innovative ways to present data. Our discoveries can aid gallery evaluations and museum studies in the British Museum and elsewhere as well as provide valuable data and recommendations on the gallery.
Methodology
Our methodological approach incorporated the basic methodologies of past evaluations with innovations of our own. The basic methodology involves using manual “pen and paper” visitor tracking paired with questionnaires given to those who were tracked. In order to reach the previously inaccessible group of non-English speaking visitors, we translated our questionnaire into 17 languages, using images to convey ideas wherever possible, for example in the map below which was used in our survey. This facilitated increased engagement with non-English speaking visitors.
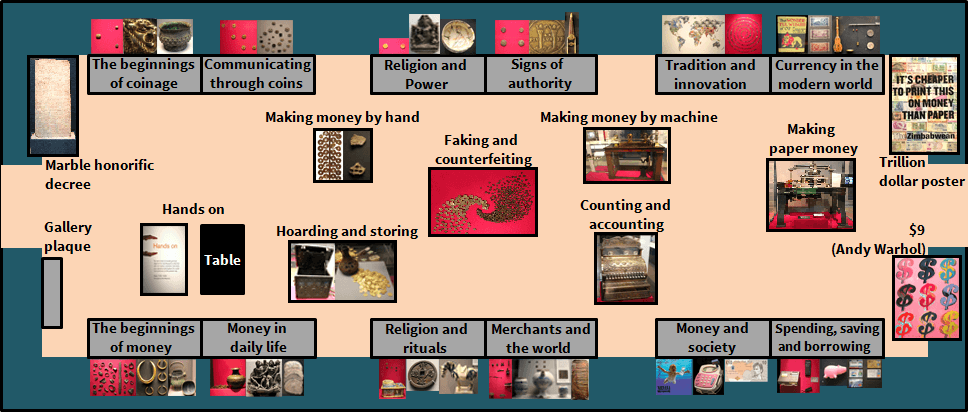
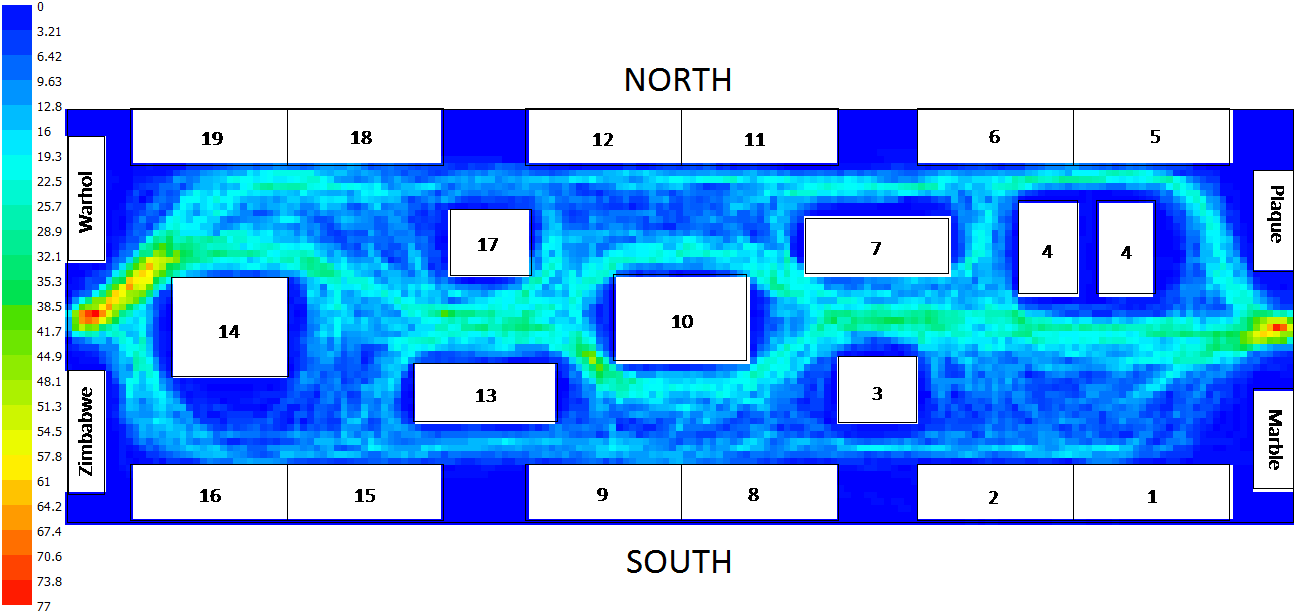
We discovered new software, Syntax2D, which enabled us to present visitor paths in a new understandable way, shown in the map below. We also went beyond our basic requirements, tracking 360 visitors, instead of 300, and giving 128 questionnaires, instead of 100.
Findings
Our methodology enabled us to make useful findings about the gallery from our data. Some of our findings were guided by specific requests from the museum. We found that the median time spent in the gallery is 131 seconds (2:11) and the mean time spent in the gallery is 207 seconds (3:27). We also found out that 15 % of visitors were able to recognize Citibank as the sponsor of the gallery when presented with logos of various banks as options for naming the sponsor. In addition, the new methodologies we developed allowed us to make new kinds of findings. These findings covered many topics including visitor attendance, the diversity of visitors in language and nationality, as well as visitor travel and tendencies within the gallery.
Visitor counting enabled us to calibrate the electronic visitor counter installed in the gallery. We discovered that the electronic counter has a linear relationship with the number of visitors to the gallery. The counter fairly consistently underestimated the number of visitors by 25%. Since the combined walkthrough and turnaround rate was 28%, this means that the visitor counter can be used for a rough estimate of engaged visitors in the gallery.
As the British Museum is a major London attraction, the gallery draws many nationalities of visitors. Only 20% of visitors to the Money Gallery were from the UK, followed by 13% from USA, 10% from Spain, and 8% from Italy. Our translated surveys allowed us to reach international visitors, get their opinions of the gallery, and study their interaction with it. Our questionnaire refusal rate for this study was 38%, lower than last year’s rate of 48%, primarily due to our multi-lingual survey. We discovered that some visitors opt to take the survey in English rather than their first language even when their language is available.
The new software tool, Syntax 2D, shows the flow of visitors through the gallery, which has not previously been easy to interpret. Syntax 2D’s heat map style presentation is familiar and well suited to mapping a gallery and makes it easier to identify trends in paths. For example, we showed that more visitors traveled the north wall than the south wall. Indeed, 35% of visitors turned north upon entering the gallery while 27% turned south.
Recommendations
Our recommendations stem from the findings we made during this study. Some of the recommendations for the gallery included making the new Bitcoin case more attractive by adding more eye-catching pieces, making the wall cases and their info panels more visible, adding translated versions of English texts to cases, and finding ways to encourage visitor flow to follow the gallery flow. For future studies we recommend continuing use of translated surveys to increase response rate and using Syntax 2D to understand visitor flow. The gallery could also benefit from future studies performing a meta-analysis on case content using past data, and developing a more streamlined way to electronically enter visitor tracking data.
Find our final report here.
ACKNOWLEDGEMENTS
Our team would like to thank our advisors, Laureen Elgert and Scott Jiusto, for their assistance in completing this project. We would also like to thank our liaison, Ben Alsop, for all of his help and encouragement during the course of our term abroad, as well as the entire Department of Coins and Medals for hosting us. In addition, we would like to thank David Francis for all his insight into gallery evaluations. We would like to thank Rebecca Ziino for her assistance in developing research strategies and Alyssa Corini for talking to us about her experience in the gallery in E term.
We would like to thank all of the people who were a part of translating our survey into 17 languages: Natasa Trkulja, Stella Banou, Marinela Kirilova, Carina L’hoste, Lamyae Reklaoui, Luis Quiroga, Gabriel Morell-Pacheco, Adriana Morell, Timothy Momose, Jingan Wu, Kwan Yeong “Ashton” Kim, Loan Chau, Magnus Gregersen, and Atieh Sadraei.
Giancarlo Savoy – Electrical and Computer Engineering 2015
Anjali Venkatesh – Computer Science 2015
Lillian Walker – Robotics Engineering and Mechanical Engineering 2015
Eli Wolfang – Mechanical Engineering 2015
