

Hounslow Council: Hazard, Vulnerability, and Risk
| Sponsor: | London Borough of Hounslow Contingency Planning Unit |
 |
| Sponsor Liaison: | Twm Palmer | |
| Student Team: | Adam Lemoine, Dan Lipson, Scott Lonergan, Alison Marotta | |
| Abstract: |
The goal of the project was to produce hazard, vulnerability, and risk maps of the London Borough of Hounslow for improved emergency planning. The team collected hazard information from the Community Risk Register and emergency plans to identify and map hazards. We used 2011 UK Census data to identify and map vulnerable populations who might be more susceptible to harm and slower to recover from hazard events. The team combined several Census variables to produce composite indices of vulnerability (‘Economic Stability,’ ‘Minority Status,’ ‘Evacuation,’ and ‘Public Health’). The maps of hazards, vulnerabilities, and risks will be used by the Contingency Planning Unit of the London Borough of Hounslow to better prepare for emergencies in the future. |
|
| Link: | ||
Executive Summary
The United Kingdom experiences numerous emergencies each year, resulting in many deaths, injuries, and damages to properties. As a result, the government passed the Civil Contingencies Act (CCA) in 2004. This act requires local authorities within the government to develop emergency plans for preparing, responding to, and recovering from hazardous events. In the London Borough of Hounslow, the Contingency Planning Unit (CPU) is the division responsible for preparing these emergency plans by assessing the local risks within the borough.
The overall goal of this project was to develop a suite of Geographical Information Systems (GIS) maps illustrating vulnerable groups of people, the most significant hazards, and the risks within the London Borough of Hounslow. We accomplished the goal of this work by completing the following set of objectives:
- identified the GIS map requirements desired by CPU staff members;
- mapped hazards and vulnerable populations within the borough; and
- interpreted hazard, vulnerability, and risk maps.
We conducted a detailed literature review to determine how hazard, vulnerability, and risk have been conceptualized and mapped in past research. We used internal sources of data, including emergency plans, risk registers, flood maps, and other data on the locations of petrol stations and transportation infrastructure to characterize the location and extent of hazards in the borough. We also used data on COMAH (Control of Major Accident Hazard) sites, which we supplemented and verified by interviews with emergency planners in neighboring boroughs, to identify additional hazards within and outside the borough. We developed a composite map of hazards affecting the borough (Figure A), which shows several areas of particular concern. For example, several petrol stations are located in flood-prone areas (areas C and D) and several areas may be affected by compound risks, such as the combination of chlorine storage facilities and petrol stations in close proximity, as at location A. With this detailed information, emergency planning officials may consider areas where multiple hazard types overlap when developing procedures for responding to incidents within the borough.
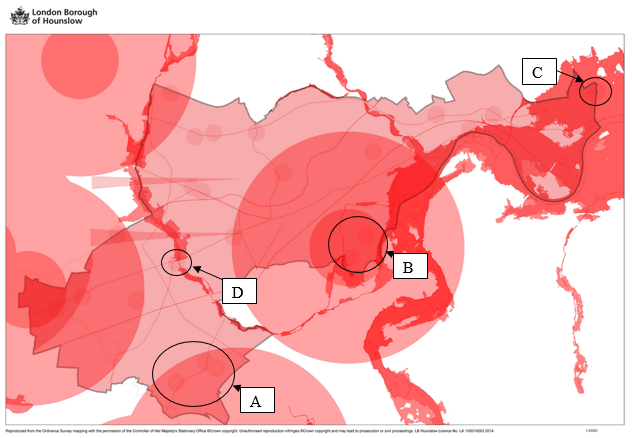
Figure A: Composite Hazard Map
We utilized the 2011 UK Census data in order quantitatively map various vulnerable populations. Based on the information obtained from the first objective and the literature review, the team identified the most relevant indicators of social vulnerability and placed them into composite indices that we called: ‘Economic Stability,’ ‘Public Health,’ ‘Evacuation,’ and ‘Minority Status.’ The table below shows the groups and associated indicators or variables from the Census data.
| Group | Indicator |
| Economic Stability |
· Education · Gender · Language · Occupancy · Occupation · Renting · Unemployment · Vehicles |
| Public Health |
· Age · Disability · Health · Occupancy |
| Evacuation |
· Age · Density · Disability · Gender · Health · Language · Migration · Occupancy · Vehicles |
| ‘Minority Status’ |
· Gender · Language · Migration |
Table A: Grouping of Social Vulnerability Indicators
We calculated a vulnerability score for each indicator at the Lower Layer Super Output Area (LSOA) level. LSOAs are small geographic areas commonly used to analyze UK Census data. We chose to use LSOAs because they provided the best balance between resolution and ease of use. The team used Z-Scores in order to score every LSOA for each vulnerability indicator. We then summed the positive Z-scores within each group and LSOA in order to obtain a vulnerability rank for each composite group at the LSOA level. The team submitted a comprehensive spreadsheet to the London Borough of Hounslow’s GIS Team who then imported our data into the local GIS system. We constructed vulnerability maps using the GIS system for each individual vulnerability indicator presented in Table A and generated maps for each composite group. An example of an individual vulnerability indicator map is presented in Figure B, and an example of a composite vulnerability map is presented in Figure C.
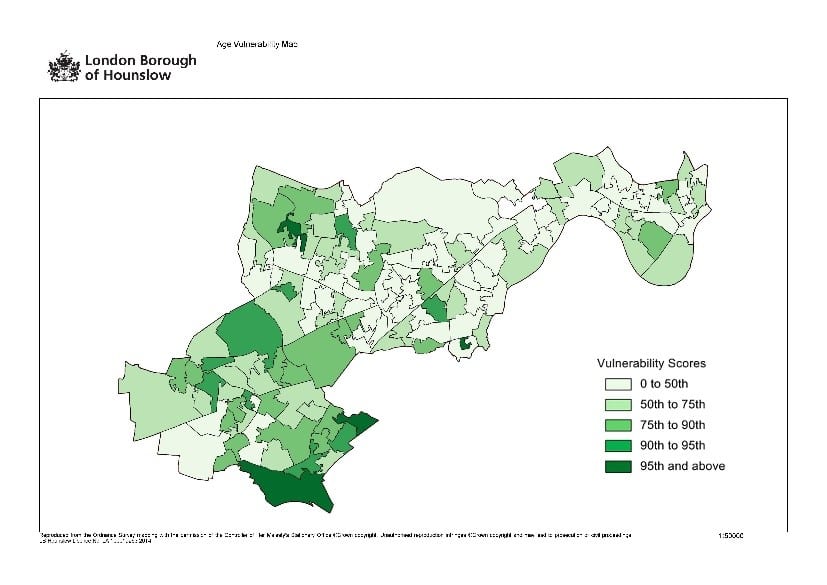
Figure B: Vulnerability by Age

Figure C: ‘Public Health’ Group Vulnerability Map, Adjusted
The maps created in this project are intended for use by staff members of the CPU and emergency planners in order to identify vulnerable populations and areas at risk in an effort to improve emergency response plans and procedures. These maps show the hazards of greatest concern to the borough, the location of populations that may be the most vulnerable due to a variety of factors, and the risks associated with hazards and vulnerability. The team created 13 individual vulnerability maps, 4 composite vulnerability maps, 3 hazard maps, and 3 risk maps. Furthermore, the team developed a user guide which provides a detailed description on how to generate additional maps. This user guide will allow CPU staff members to generate new and revised vulnerability and hazard maps as the demographics of the borough changes.
We conclude that hazard and vulnerability mapping offers a way for the borough to better plan for future emergencies, but we recommend that the borough updates these maps as new information becomes available. Upon the release of the 2021 UK census data, we recommend using the guide we provided to replicate our process and adjust emergency plans accordingly to fit the new landscape of vulnerable populations in the borough. The team also suggests exploring hotspot and factor analysis to streamline and produce a more fine-grained breakdown of vulnerability within Hounslow. Lastly, we recommend producing a layer within the GIS system displaying the businesses of the borough to help minimize economic damage during an event as well as having a better idea where the working population is during the week day for planning purposes.