

Evaluating the China and South Asia Gallery at the British Museum
| Sponsor: | British Museum |  |
| Sponsor Liaison: | Stuart Frost, Head of Interpretation & Volunteers | |
| Student Team: | Jack Duffy-Protentis Yufei Gao Yuanda Song Amanda Toledo Barrios |
|
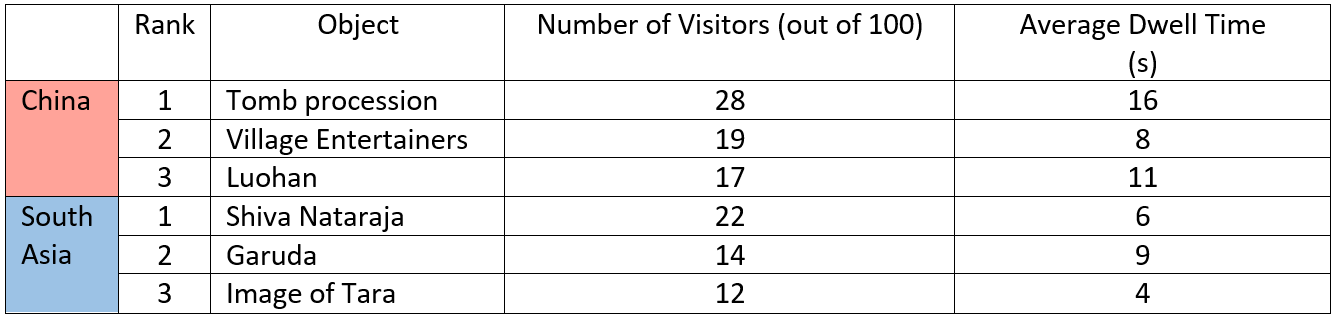
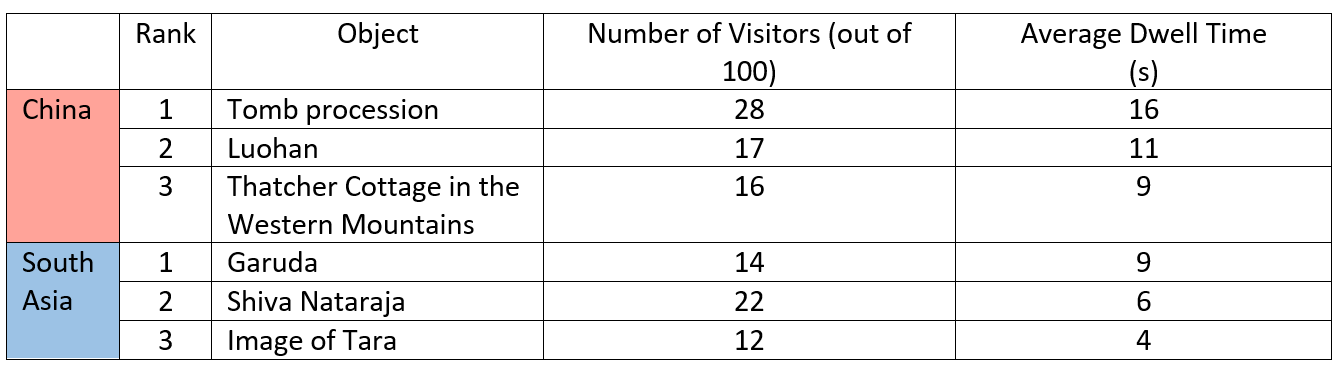
| Abstract: | The goal of this project was to evaluate visitors in the revitalized China and South Asia gallery at the British Museum. To achieve this goal, we determined best practices in museum evaluation, identified the British Museum’s goals and protocols, and evaluated visitor behavior. Through tracking and surveying visitors, we found that: the most visited bays were Qing, Late Ming, and Early Ming; the most popular object was the Tomb Procession; 64% of the visitors began with the right side of the gallery, and the average dwell time was 18 minutes. To further improve the gallery, our recommendations were to add more audio descriptions, to clarify how the museum gained possession of the objects, and to incorporate QR codes on object labels to provide further information in multiple languages. | |
| Link: | Project report: Evaluating the China and South Asia Gallery at the British Museum Final presentation: BM Final Presentation |
|
Executive Summary
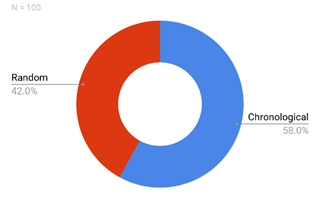
Since it first opened in 1992, the China and South Asia gallery (Room 33) has helped millions of visitors experience its rich history through its plethora of objects, paintings, and sculptures. Along with its successes, however, the gallery encountered many problems. For example, from an evaluation conducted from a pool of 100 visitors, within the first five minutes after entering the gallery it was found that visitors engaged randomly with objects and did not read any labels. Thus, after remaining the same way for 25 years, the gallery underwent a major refurbishment and re-opened in November of 2017. Within this refurbishment were several major changes such as the content within the gallery was condensed and brought up to the present, the structure of the bays was laid out chronologically, and the gateway object approach was introduced. To see if this redisplay has improved the flaws from the original gallery, this project was designed to evaluate visitor behavior in this redisplay of Room 33.
During the fourteen-week period that the team worked on this project, we broke down the project into three objectives: (1) determine best practices in current exhibit evaluation and in the use of gateway objects to enhance wayfinding, (2) identify the British Museum’s goals for the re-presentation of Room 33 and utilize their visitor evaluation protocols, and (3) evaluate how visitors behave in the introductory zone and rest of Room 33. While the majority of objective one involved extensive desk-based research seven weeks prior to arriving in London, this research was further supplemented with museum expert interviews during our time in London to gauge a better understanding of best practices in museum evaluation and in wayfinding. The completion of objective two, on the other hand, was completed once at the British Museum through interviews with six British Museum staff (Yi Chen, Imma Ramos, Tess Sanders, Sushma Jansari, and Jessica Harrison-Hall), including our Sponsor (Stuart Frost), which helped the team come up with major questions that our evaluation would address. These questions include:
- Are visitors engaging with and reading the labels?
- Are the gateway objects effective in captivating visitors?
- What are the hot spots (areas of main attraction) in the gallery?
- Is the chronological flow of the gallery being followed?
- What are visitor demographics?
- Where do visitors turn upon entering the gallery?
- What do visitors think of the redisplay of Room 33?
Through the 300 hours of work dedicated to tracking, observing, and surveying visitors to complete objective three, our analysis of the data provided answers to those main questions.
- Are visitors engaging with and reading the labels?
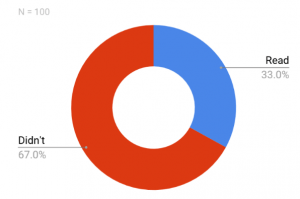
According to the 100 visitors we tracked, only one third actually took the time to read either the information panels at the introduction of each bay, the gateway object descriptions, or the labels provided per object.
- Are the gateway objects effective in captivating visitors?
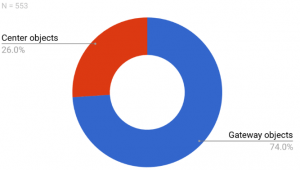
This analysis was done by recording the dwell time of each visitor tracked at the left, center, and right cases of each bay. Since the gateway objects are placed in the left and right cases of a bay, if a visitor traveled to either of these cases upon first entering a bay, it was marked down that the visitor engaged with the gateway object. On the contrary, if the visitor approached the center case first, then the main attraction for that visitor was not the gateway object. Since our results reveal that 74% of visitors utilized the gateway objects, we concluded that they are a successful approach to captivating visitors.
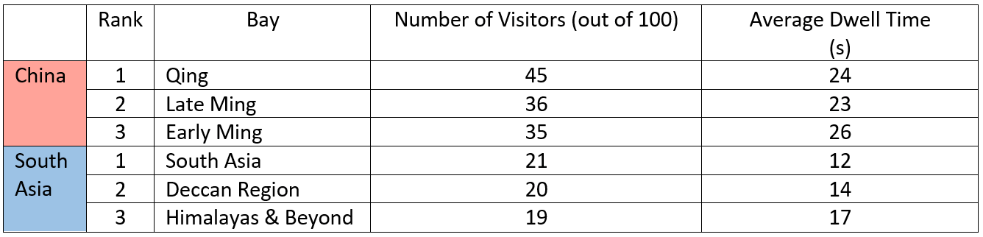
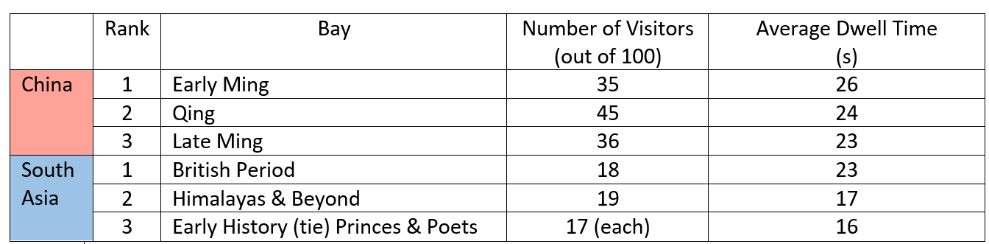
- What are the hot spots (areas of main attraction) in the gallery?

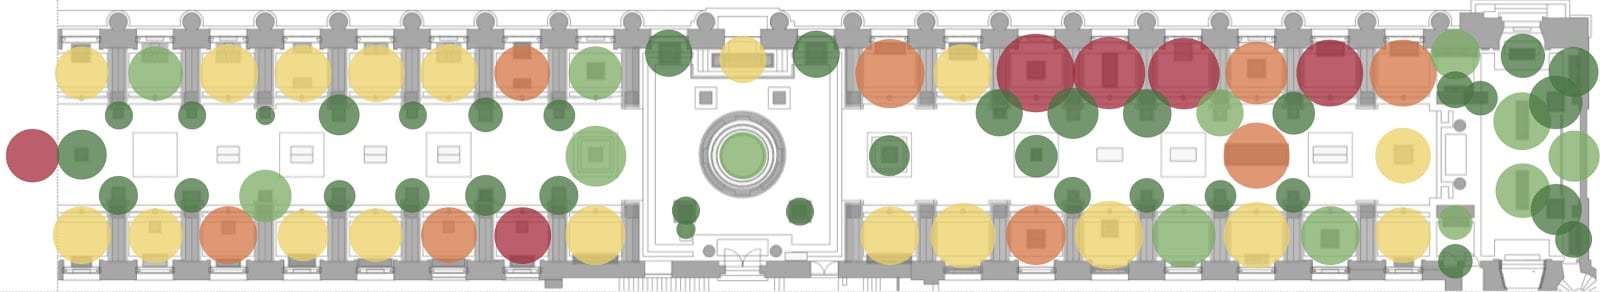
This heat map was created by plotting all of the visitor dwell times and number of visitors throughout the gallery. The radius of the circle represents the number of visitors at each spot of the gallery. Thus, a larger circle represents a larger visitor population. Also, each color (green, light green, yellow, orange, and red) represents the average dwell time in seconds. Since the China side of the gallery contains the largest and most prominent red circles, it is the most popular side of Room 33. These hot spots were further broken down into popularity based on the number of visitors and average dwell time.
- Is the chronological flow of the gallery being followed?

Visitors were noted down as following the chronological order if they either followed a clockwise or counterclockwise path throughout the bays in the gallery. From the 100 visitors that were tracked, the majority did follow the chronological order laid out in the gallery. The remaining 30%, however, did not.
- What are visitor demographics?
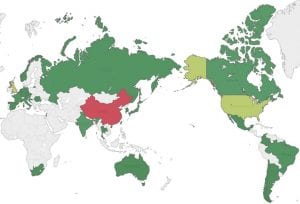
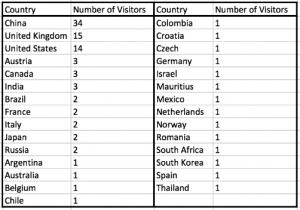


Our exit-surveys given out to 100 visitors revealed that the majority (34%) of visitors are from China. This is replicated in the choropleth map of the world where China is the most red. The next two top countries represented in Room 33 are visitors from the United Kingdom and the United States as shown in light green on the map. Furthermore, the age and gender breakdown is shown below. There is about a 1:1 ratio of male to female and the majority of visitors are between 25-34 years old.

- Where do visitors turn upon entering the gallery?
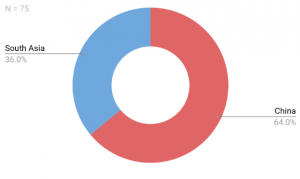

The majority of visitors turn right towards the China side of the gallery. We believe this percentage is so high because the majority of visitors of Room 33 are Chinese. Furthermore, our background research revealed that people have an unconscious bias to turn right rather than left.
- What do visitors think of the redisplay of Room 33?


In our survey we asked visitors to give comments and suggestions about what they thought about the gallery; this word cloud represents a summary of what the visitors thought. The larger text represents the most common words in all of the suggestions. So, in this case, the words “Chinese,” “description,” “label,” and “interactive” are represented. Since a majority of visitors are from China, they consistently told us that they wanted more descriptions and labels of objects in Chinese. Another frequent suggestion was to make the gallery more alive by introducing more interactives.
Although there are more results in the report, these are the key findings that we found from our evaluation of Room 33. Overall, our data shows that the changes made during the redisplay of the gallery have helped it be more successful compared to the original gallery.