

Executive Summary
Innovation is viewed as a key factor in establishing a healthy business ecosystem. In addition to being the home of three major universities and three Crown Research Institutes, Wellington hosts an abundance of researchers, 1 for every 250 residents. These numbers all seem to indicate that the Greater Wellington Region should possess strong rates of innovation and growth, however this is not the case.On the contrary, over the past few years concerns about the lack of innovative growth in Wellington have come to the forefront.
Grow Wellington (GW) was formed in 2007 as an agency aimed at implementing the economic initiatives of the Wellington Regional Council. GW believes that constructing an interactive visual representation that depicts entity information may provide an effective way to help address the barriers limiting innovative growth and foster collaboration in the region. Our goal was to collect organization data, visually display it in a way that highlighted connections between different organizations, and assess the feasibility of this kind of tool.
Background
Methodology
Findings
Recommendations
Conclusion
Background
Taking into consideration the businesses, universities, Crown Research Institutes (CRIs), and Crown Entities (CEs), Wellington houses a significant number of innovation centers. These facilities provide the region with an abundance of skilled workers and cutting edge research. Furthermore, the city holds the highest percentage of individuals with post high school qualifications in New Zealand and entertains an abundance of well-trained researchers. In theory, this range of resources provides a potential source for significant partnership in innovation and research, but in reality the overall level is low.
One of the most interesting aspects of this region is that the idea that there are barriers to innovation is not a new phenomenon. In fact, this has been acknowledged for the better part of fifteen years. While levels of innovation may be low, Wellington is not lacking in attempts to assist collaboration. Research institutes like the MacDiarmid Institute bring scientists together under one roof in an attempt to create a collaborative atmosphere. GW helps organizations access research and development (R&D) grants and in the field of science and technology, they implement a number of initiatives to promote technological advances through collaboration with research institutions.
An innovation ecosystem is a concept that is closely coupled with innovation research. This concept is defined as a large concentration of innovation centers usually contained within a geographical area. Just as a biological ecosystem relies on some degree of equilibrium of energy transfer to survive, an innovation ecosystem requires a balance of exchanges between its resources and participants to be successful. Within the Wellington innovation ecosystem exists a great deal of clusters; or smaller, more specific groups of entities which work with and rely on each other. Often the more closely connected these clusters become, the more easily innovation in the region can grow.
We closely examined the history and traits of successful innovation ecosystems around the world and came across a case study of Silicon Valley. This study provided us with the valuable mantra, “some secrets are more valuable when shared”, a mindset that does much to successfully drive innovation forward.
Parallel to learning more about Wellington’s business and innovation atmosphere, we also analyzed a variety of potential software programs and mapping tools which were available to use for our visual representation.
Methodology
To achieve our goal of developing an interactive visual representation of Wellington’s innovation ecosystem, we developed a series of objectives that were essential to the success and completion of our project.
Our first priority upon arrival in Wellington was to become fully immersed in the everyday customs and conduct of the region’s business and innovative practices. As part of our site assessment we conducted in-depth interviews and a driving tour. Our driving tour allowed us to visualize the geographic and economic differences between the various districts of Wellington. With this information, we compiled a list of factors that we believed would be useful content to include in our map.
To gather the chosen information for our visual representation, we designed a data collection sheet using insight from our interviews and research. The finalized data sheet was sent to one set of biotechnology companies through email and used as a prompt during interviews with the second portion of companies. We used these two methods so that we could compare and contrast the level of data received from both. In addition to the two methods, we completed each company’s form using only publicly available information to verify that the information matched. We sorted and organized the information and identified how each piece of data would be used in the map. Once a software program was selected and the organized data was coded into the coding language XML, we hosted the map shown in Figure 1. The full description of the map and what everything represents can be found on page 27 in the full report.
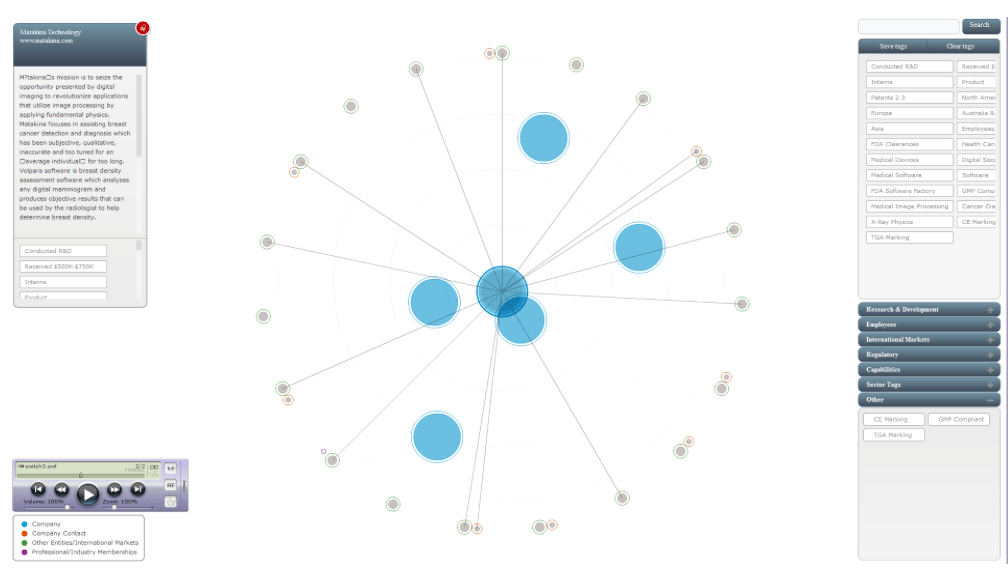
Figure 1: Screenshot of the Final Visual Representation
We used this complete pilot map to facilitate a focus group including a diverse variety of representatives from Wellington’s innovation ecosystem. This gave us the opportunity to identify strengths and weaknesses of the data collection process and the feasibility of continuing the project. We also took the opportunity to identify future paths that the map could take. With the focus group complete, we compiled a list of recommendations for GW’s consideration.
Findings
Site Assessment
Our site assessment found that barriers to innovation were quite complex and encompassed multiple aspects. Our findings revealed two major barriers: cultural facets and geographic features, both of which affect Wellington’s overall ability to innovate. New Zealand’s culture has long been known to support a ‘do-it-yourself’ attitude and to possess an overall hesitancy for accepting or seeking out help. Specific cultural phenomena like Tall Poppy Syndrome and No. 8 Wire support this attitude and are quite prominent. The Greater Wellington Region also presents many geographic and socioeconomic obstacles. Mountains and valleys present natural constraints and sometimes make accessibility a challenge. These districts, each with their own landscape and socioeconomic state, make the GWR an extremely diverse region.
We examined Wellington’s culture to innovate. Culture to innovate simply evaluates whether or not a region’s culture either supports or inhibits innovation. While in the past New Zealand’s cultural phenomena told a tale of a strong and independent country, they now sometimes hinder collaborative business practices. Furthermore, even though Wellington has strong social connections, they do not always translate well into business relationships.
The culture to innovate is also inhibited by the geographical spread, seen in Figure 2 below; these very different areas often face quite varied opinions about what is best for the region as a whole.
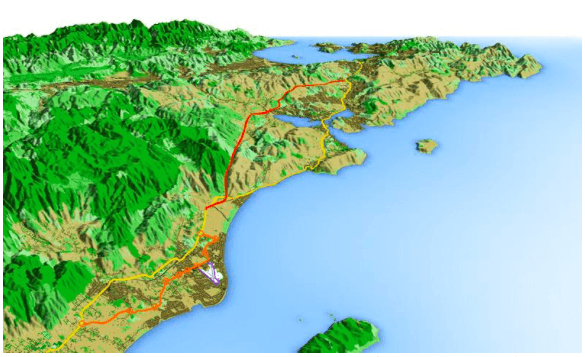
Figure 2: Topography of the Greater Wellington Region (Kapiti Landing, 2013)
Data Collection
By testing two data collection methods, questionnaires and interviews, we identified pros and cons for each. The emailed questionnaire technique was the easiest method for distribution, but made it difficult to communicate the purpose, importance, and timeline of returning a completed data sheet. Using the interview method we discovered that we were able to acquire data in a shorter timeline, but the overall process took a sizeable portion of time from a work day and yielded more generalized and estimated data. In an overall comparison of the methods we found that both techniques returned similar amounts of information.
After examining the pros and cons of each method and considering the eventual plan for scale up, the emailed questionnaire was selected as the more feasible data collection method. We were also able to investigate what information should be added or taken away from the collection sheet and what questions yielded the best information return. Additionally, we looked at the data collection process as a whole and at the kinds of remarks we received to gauge its ease and efficiency.
Visual Representation
The visual representation resulting from the Massey University software created a tool that could identify connections and provide a description of each entity in the ecosystem. The software also allowed for the data to be filtered and searched. A drawback of the software was that we could not change the user interface code, only the background XML code. This caused formatting issues such as problems with displaying the tags and the actual software only having the capacity to host a limited number of entities. We determined that the software had too many flaws and could not organize and present the amount of data our visual representation requires.
Focus Group
We were able to collect valuable feedback on the map concept by running a focus group. The discussion included concerns about the value added and usefulness of the visual representation as a whole, in addition to questions about how the information displayed would be kept up to date. The general consensus from the business perspective was that unless there was an incentive to participate, the value of this particular concept could not be seen. To counter this, the focus group offered an assortment of possible alternative uses for our visual tool. A shifted focus towards the academic portion of the ecosystem was suggested as well as use for GW internally.
Recommendations
After collecting and analyzing our relevant data, we compiled a list of recommendations for GW’s use in the future development of this project.
Specially Designed Software
Based on our findings using the Massey model software, we recommend that GW does not continue to use this particular software in further phases. While it was effective to demonstrate the concept within a single cluster, this software cannot handle the sheer amount of the data that will be required for a complete map. Upon researching software that could provide a better match for the data, it became apparent that no existing software would be an exact match for this particular project. We recommend that Grow Wellington consider having software designed to fit this project’s specific needs.
A Data Sheet Directly Linked to the Map
To ease the process of generating the map and to reduce the work required to compile, organize and code incoming data, we recommend that the software have the capability to link the data collection method directly to the map.
Information Upkeep
Currently, the information in the map is static and will eventually go out of date. To populate the map, someone had to collect and code the data into the map. Both collection and coding take large amounts of time; this means that it is entirely possible that information collected may go out of date before the map is even hosted. We recommend that GW take into consideration the ways that they will keep the map up to date.
A New Direction and Focus
To parallel suggestions made to improve the initial use of the map, we also created recommendations for a shift in the map’s focus. We suggest that GW narrow the focus of the map to entities which have the most obvious uses for it. Potential shifted uses may lie in an academic focus, a startup focus, or an internal GW use.
Back to Top
Conclusion
For the next phase of this study, a visual representation tool has the potential to add a resource and value for entities in the Greater Wellington Region. However, the map will have minimal effect unless the visual representation can align with area expectations and practices that impede innovation. Regardless of the changes made, the map will not be entirely successful unless the community it is designed for can see its value and begin to use it to its full potential.
Our focus group showed that business leaders believe they have strong networks. Though they recognize the weak networks that start-up companies face, business leaders feel that there is no added value for them from a tool like this. If both the problem and the potential for collaboration can be shown to exist to the business community, practices could start to shift, and the map would be viewed as a valuable tool for change. The problems facing innovation in the Wellington region are by no means a quick fix, and the changes will have to continue over a long term. However, Wellington’s extremely strong social connectivity has the potential to help improve innovation if it can develop into strong business connections.