

Thinking Differently about Community Engagement in Conservation

Sponsoring Organization: Para la Naturaleza: Elizabeth Padilla & Alexandra Berríos Feliciano
Team Members: Holly Hazelton (Architectural Engineering ’23), Abigail McLean (Mechanical Engineering ’23), Sean McMillan (Computer Science ’23), & Emma Shulenburg (Biomedical Engineering ’23)
Professor Leslie Dodson and Professor Robert Hersh
Para La Naturaleza (PLN), an organization working to conserve natural protected areas (NPAs) in Puerto Rico, is developing plans to more effectively engage communities to co-manage NPAs. Our team mapped census data on a geographic information system and developed new forms of community profiles to help PLN not only better understand the communities it works with, but to share the information with PLN staff. These tools were created as a starting point for PLN to use and adapt for continued development of community outreach programs and to anticipate opportunities for effective collaboration.
Executive Summary
The conservation strategy for working with the communities around natural protected areas (NPAs) has evolved over the past decade. Historically, conservation organizations focused on reducing human impact on protected areas. Studies have found that limiting community access to NPAs can lead to land-use conflicts and tensions when neighboring communities previously utilized the land (Cernea et al., 2006). Today, many organizations are making the switch to co-managing NPAs with neighboring communities. Including the communities in decisions about the land not only encourages compliance with conservation strategies but also encourages sustainable ecological practices for the future (Ban et al., 2008).
Para La Naturaleza (PLN) is a non-profit organization in Puerto Rico focused on protecting the NPAs on the island through community collaboration. PLN manages 66 NPAs and is working to develop co-management practices with communities through its AComPAÑA program. PLN works directly with each of the 12 communities that participate in the program across the island in order to expand PLN’s network (Rodriguez & Morales, 2020). PLN has Community Action Leaders (CALs) who work directly with the communities in the AComPAÑA program. Each community has its own history and in order to build a relationship, PLN has begun to reorient its collaboration with communities.
Methods
The goal of this project was to develop new forms of community profiles to support PLN’s collaboration with communities around NPAs. To collect information for this profile, we focused on key informant interviews with different members of PLN’s staff and created a map with both census data and data about PLN influence. These interviews focused on the interactions between PLN and the communities. The topics of vulnerability and resilience were discussed to determine different perspectives within the organization. We used data from the 2020 and 2010 US census to map population, age, poverty, and unemployment at the census block group level. These maps displayed trends over time and the intersection of vulnerability factors. We created community profiles that integrated maps, data, and findings from interviews, using Esri StoryMaps as the host platform to give PLN a new perspective of the communities around its NPAs.
Findings
Our first analysis considered economic factors, primarily the percentage of people living under the poverty threshold and unemployment rates. These factors determine the ability, or lack thereof, for communities to rebuild or improve infrastructure after an extreme event (Federal Emergency Management Agency, n.d.). An overlap between high poverty and high unemployment can indicate areas of economic vulnerability. We classified these block groups as vulnerable if the poverty rate is above 50% and the unemployment is above 10%. We displayed the intersection of these variables on a map, as seen in Figure 1, to indicate the relation of vulnerable communities to NPAs. For example, there is a large amount of overlap in the central region which is near multiple NPAs, including Hacienda Pellajas, Los Frailes, and Ojo de Agua.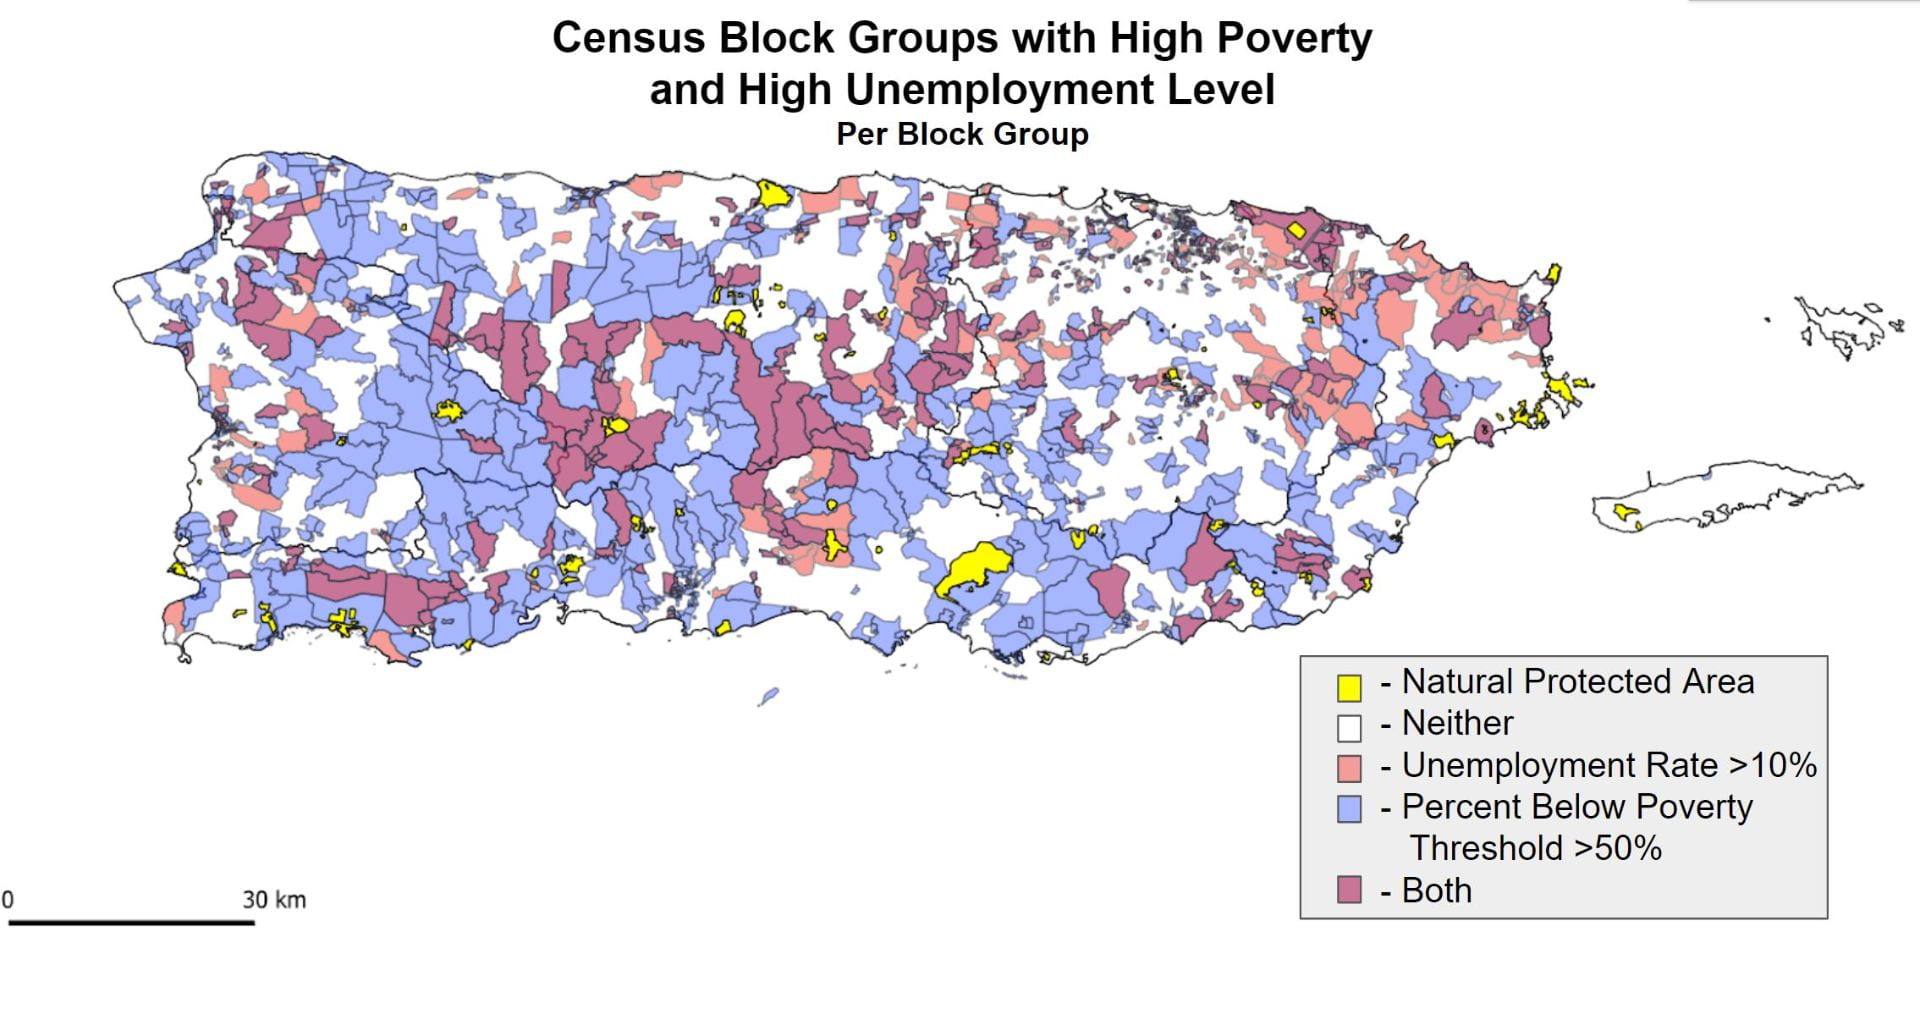
Figure 1: The map above displays where high poverty rates and high unemployment overlap
The second vulnerability analysis considered the social fabric of communities, more specifically population density, population change, and community age structure. These are key factors that can affect areas that struggle with school program enrollments, retirement support, and other social structures (Pérez & Ailshire, 2017). The economic and political climate and multiple hurricanes have led to a high rate of migration of young Puerto Ricans to the mainland United States (Acosta et al., 2020). Since the predominant group that has left the island are young, working-age individuals, the median age has increased by 6 years in many places across Puerto Rico. The majority of block groups indicated a decline in population and increase in age from 2010 to 2020. When combining both median age and population change, we classified a vulnerable population decline as over 15% and an age decrease as over 8 years as these are above the island average. The areas where the population decreased and the age increased indicate areas of high social vulnerability as seen in Figure 2. By analyzing this data in relation to the current program and school locations, new opportunities for outreach could be identified.
Figure 2: This map shows the intersection of a declining population and an increasing median age per block group
Along with quantitative analysis, the history of the communities influence the CAL outreach. From our interview with CAL José Nevárez Rivera, we learned that in the La Esperanza community, many people had historical ties to the site due to its plantation past. Additionally, past conservation strategies also impact how communities relate to PLN’s efforts to encourage community participation. According to José Nevárez Rivera, many communities felt resentment towards conservation organizations for excluding them from the natural protected land they previously used (J. Nevárez Rivera, Personal Interview, November 5, 2021).
According to Karina Rodríguez, the CAL for the Metro-Central region, PLN encountered challenges when trying to build new relationships with new communities due to their negative experience collaborating with other NGOs. Karina Rodríguez emphasized the importance of consistency, showing results, and demonstrating that PLN is able to accomplish things in neighboring communities. Otherwise, “the communities talk” and interest will wane (K. Rodríguez, Personal Interview, November 18, 2021).
When PLN begins to work with communities, CALs first assess community needs. In an initial survey, CALs hold a town hall with local leaders to discuss results from the survey and decide areas of assistance. For La Esperanza, this included adding lighting infrastructure to roads around the NPA and community to address dark pockets while not disrupting wildlife (J. Nevárez Rivera, Personal Interview, November 5, 2021). Listening to the community and demonstrating results helped PLN establish a better working relationship with the community. In order to continue improving those community relationships, PLN needs to compile a more comprehensive analysis of community data.
Our solution to incorporate the multi-faceted nature of vulnerability in a community profile is through Esri’s StoryMap platform. PLN’s current PDF style report does not display spatial awareness, change over time, or explicit measures of vulnerability. As discussed above, communities have very specific histories and function differently from one another. Through Esri StoryMap, we constructed a community profile that represents the community through pictures, maps, and videos, as well as text from our analysis of interviews, maps, and site visits. This will, we hope, give CALs a holistic picture of communities they plan to work with in the future.
Future Research
The next steps for the project would be to develop and refine community profiles at different NPAs. We focused on only two NPAs and three communities. Around Hacienda La Esperanza, in the North Region, we investigated the communities La Esperanza and Cialitos. Around Antiguo Acueducto in the Metro-Central Region, we looked at the Buen Consejo community. Our current community profiles do not extend to PLN’s South, East, or West regions. Adding new communities to the profiles around additional NPAs would provide a more complete view of the variability between communities across the island. One of the AComPAÑA communities in the southwest, Papayo, would be a relevant starting spot, as PLN expressed interest in including this community, especially with an NPA right next to the community. Another community in the south that would be beneficial to study is Ponce because they have an NPA near the city and this is an urban area with several block groups with decreasing median age. These two communities would allow for a community profile on an urban and rural area of the island like we did with La Esperanza and Buen Consejo
Other areas of further research could be in the northwest by finding new PLN partners to expand its radius of influence. The northwest region of the island has the largest gap in PLN’s network. Creating a profile for a community in this area could assist in forming new relationships in the area and expanding PLN’s influence. For example, there is an NPA near Quebradillas which falls outside PLN’s radius of influence. With a better understanding of the dynamics or the area through a profile, new CALs would have a basis to begin a relationship with them. This could assist in PLN’s goal of co-management of the NPAs in the region.