

- Act III Scene I: Adding Color (November 16, 2015)
- Slideshow Test
- “Bawawethu” (December 3, 2015)
- Social Enterprise
- Acronym Dictionary
- Background
- About CTPC
- Blog
- Resource Library
- Welcome!
- Projects
- Projects Overview
- 2015
- Expanding Early Childhood Development Opportunities in an Informal Settlement
- Exploring New Outreach Models for Early Childhood Development
- Fostering Community at the Canterbury Street Lot
- Background Research
- Philosophy Behind Helping the Homeless
- Belonging and its Psychological Impact on Street People
- Establishing Social Inclusion in the Street Community
- Understanding Homelessness’ Role in Urban Development
- Investigating the Effect of Public Spaces on Cities
- Creating a Sense of Community Through Green Areas
- Commemorating the Street Community’s Lives
- Partnerships
- Planning
- Outcomes
- Resources
- Background Research
- Providing More than a Meal at Service Dining Rooms
- Upgrading the K2 Informal Settlement through Community Collaboration
- Background Research
- Planning Pages
- The Partnership
- K2 Journey
- Act I Scene I: New Beginnings (October 22, 2015)
- Act I Scene II: Getting lost in the K2 Maze (October 23, 2015)
- Act I Scene III: The Outsiders (October 26, 2015)
- Act II Scene I: Touring Tuesday (November 10, 2015)
- Act II Scene II: Trouble in K2 (November 16, 2015)
- Act III Scene I: Luncheon: A Change of Scenery (November 17, 2015)
- Act III Scene II: Adding Colour (November 20, 2015)
- Act III Scene III: “Bawawethu” (December 3, 2015)
- Act III Scene IV: Financial Contribution: One Step at a Time (December 7, 2015)
- Project Outcomes
- Project Resources
- References
- Women’s Empowerment through Increased Access and Understanding of Technology
- Background Research
- Partnership
- Planning
- Process Narrative
- Outcomes
- Project Resources
- References
- 2014
- Empowerment through Improving Facilities at the Sizakuyenza Safe House
- The Big Issue Goes Online: Creating a Vendor-Run Profiling Program
- Early Childhood and Community Development in Flamingo Crescent
- Background Research
- Challenges of Early Childhood Development in South Africa
- Crèche Regulations and Finances
- Best Practices for Crèche Development
- Determinants of Crèche Quality
- The Effect of Playground Design on Child Development
- The Effect of Playground Design on Communities
- Developmental Benefits of Recreational Space
- Public Space Inequality in South Africa
- Recyclable Playgrounds
- Flamingo Crescent Informal Settlement
- Planning and Methods
- The Partnership
- The Play by Play
- Project Outcomes
- Resources
- Background Research
- An Entrepreneurial Initiative for Distributing Energy Efficient Products in Low Income Communities
- Background
- Planning
- Partnerships
- Project Narrative
- Act 1: Adapting our Project
- Act 2: Finding Distribution Centers
- Scene 1: Creating Interest in Wonderbags
- Scene 2: First Trip to an Informal Settlement
- Scene 3: Looking for New Products
- Scene 4: Gathering Community Energy and Crèche Information
- Scene 5: A Visit to Flamingo
- Scene 6: Just Do It: Three Crèche Visits
- Scene 7: The Reality of Low Income Areas
- Scene 8: A College for Kiddies
- Act 3: Establishing Pilot Programs
- Scene 1: Pilot Program
- Scene 2: A Second Pilot Program
- Scene 3: Sustainable Sales
- Scene 4: Low Income Energy Services Task Team Meeting
- Scene 5: Lunch at the Crèche
- Scene 6: Exploring Other Products
- Scene 7: Graduation
- Scene 8: Enjoying Electricity
- Scene 9: Collaboration for Future Implementation
- Scene 10: Keep Smiling
- Epilogue
- Outcomes
- References
- Expanding Health, Education, and Wellbeing Services and Analyzing the Effects of Underlying Social Complexities on WaSH-UP
- Background Research
- Mission & Objectives
- Cast of Characters
- Process Narrative: Our Journey
- Project Outcomes: Not Just Toilets Anymore!
- Epilogue
- WaSH-UP Sustainable Livelihoods and Business Operations
- Mission and Objectives Overview
- Background Research
- Informal Settlements in South Africa: Langrug Community
- Shared Action Learning (SAL)
- Community Assets
- What Business Institutions/Models Would Best Serve the Community?
- How to Start a Small Business in Informal Settlements
- Possible Models for Small Businesses and Savings Groups
- Ethical Considerations
- Research Questions
- Sources and References
- The Partnership
- Acts and Scenes
- Project Outcomes
- Reflection and Growth during the IQP Journey
- 2013
- Blue Sky Recycling Programme
- Community Mobilisation Through Reblocking in Flamingo Crescent
- The Partnership
- Welcome to Flamingo Crescent
- Background Research
- Methodology: Shared Action Learning
- Project Narrative
- Act 1: Trial and Error
- Scene 1: First Meeting with Levona
- Scene 2: An Introduction to 7de Laan
- Scene 3: Beginnings of Turmoil
- Scene 4: Finding Hope
- Scene 5: A Motivation for our Work
- Scene 6: Red Hill Settlement Tour Highlights Opportunities
- Scene 7: City Mission Visit Illuminates the Option of Reblocking
- Scene 8: Meeting the Key Planners
- Scene 9: First Weekly Meeting Causes Confusion
- Scene 10: Subcouncil Meeting Eases Worries
- Scene 11: A Raw and Unexpected Story
- Scene 12: Ethiopian Experience
- Scene 13: Shack Demolition
- Scene 14: Engineering the Future
- Scene 15: Public Meeting in 7de Laan
- Act 1 Reflection
- Act 2: Testing the Waters
- Scene 1: A Taste of Flamingo
- Scene 2: Getting to know the Community Leaders
- Scene 3: Cluster Meetings in Flamingo
- Scene 4: Introduction to Mtshini Wam
- Scene 5: Kuku Town Visit Provides Example
- Scene 6: All Parties Come Together
- Scene 7: Library Networking
- Scene 8: Communication and Enumeration
- Act 2 Reflection
- Act 3: Taking Care of Business
- Scene 1: Meeting the Contractors
- Scene 2: Breaking Ground
- Scene 3: If You Build It They Will Come
- Scene 4: Visiting ELRU Opens Doors for a Crèche in Flamingo
- Scene 5: A Living Virtue
- Scene 6: Meeting a New Potential Stakeholder
- Scene 7: Meeting with the CECD: “Let’s do it.”
- Scene 8: Bringing Green Innovation to the Crèche
- Scene 9: Final Stakeholder Meeting
- Scene 10: Saying Goodbye to Flamingo Crescent
- Act 3 Reflection
- Student Reflections
- Act 1: Trial and Error
- Resources and References
- Community Mobilisation Through Reblocking: An Interactive Upgrading Anthology
- Early Childhood Development Connection
- MGV Park Redevelopment
- Project Partners
- Project Outcomes
- Background Research
- Planning and Methods
- Process Narrative
- Act 1: The Beginning
- Scene 1: Arriving in Maitland Garden Village
- Scene 2: First Sight
- Scene 3: Meeting with the Project Members
- Scene 4: Community Survey
- Scene 5: Working with Co-Researchers
- Scene 6: Village Day
- Scene 7: Monday’s Meeting with Jude
- Scene 8: Monday’s Meeting with Co-Researchers
- Scene 9: Discouraging Moment
- Scene 10: Setting up the Fantasy Playscape Activity with the Crèche
- Act 2: A New Hope
- Act 3: Getting the Ball Rolling
- Personal Reflections
- Act 1: The Beginning
- Resources
- WaSH-UP
- 2012
- Capacity Building of a Community Based Organisation in Maitland Garden Village
- Meet the Team
- Background Research and Preparation
- Ethical Considerations
- Cape Town Project Centre Context
- Sponsors
- Project Work on Site
- Cast of Characters
- Meetings
- Organisational Profiles
- Act 1: Finding our Footing
- Scene 1: First Encounter with Maitland Garden Village (MGV)
- Scene 2: Tour of Maitland Garden Village
- Scene 3: Ronell’s Sight into the Help Centre
- Scene 4: First Look at the Potential Venue
- Scene 5: Getting to Know the People We are Working With
- Scene 6: Tour Of Oude Molen
- Scene 7: Village Day
- Scene 8: Monday Morning Meeting
- Scene 9: Meeting at MGV Community Centre
- Reflection and Moving Forward
- Act 2: Building Support
- Act 3: Strategy and Execution
- Envisioning a Black River Pathway: Creating a Heritage Destination through Social Development
- Research & Planning
- Cast of Characters
- Ethical Considerations
- Acts and Scenes
- Act One: Getting Started
- Scene Eight: Maitland Garden Village Day
- Scene Five: Faces of Oude Molen Eco Village
- Scene Four: First Meeting with our Sponsors
- Scene One: The First Pathway Experience
- Scene Seven: Visiting Company’s Garden
- Scene Six: A Presentation to our Sponsors
- Scene Three: Walking the Desire Lines
- Scene Two: Tour of Maitland Garden Village
- Act Two: Developing Relationships
- Act Three: Absorbing Information
- Act Four: Meeting with the City
- Act Five: Wrapping Up
- Act One: Getting Started
- Resources & References
- Laying the Foundation for a Resilient Partnership: Innovative Upgrading in the Informal Settlement of Langrug
- Welcome to Langrug
- Background Research
- Cast of Characters
- Primary Project Focuses
- Acts and Scenes: Our Observations and Reflections
- Act 1: Jumping Right In
- Act 2: Planning and Moving Forward
- Discussing the Needs of the Community and How the MPC Can Help
- Making the Decision to Move Forward with the Multi-Purpose Centre
- Reblocking Guidebook Discussion
- Re-Measuring for Reblocking
- Spacing Out ReBlocking
- Fire In Zwelitsha
- Lunch Scene
- Working Team Arguments
- Playing Games
- Introductions at the Municipality: A Revelation
- Amanda Realises the Importance of Documentation
- The Working Team Presents to the Municipality
- How Simple Office Supplies Can Spark Progress
- Further Difficulty with Planning
- Learning How to Do (and Teach) a Cost Analysis
- Act 3: Making Decisions
- Working Group Expresses Community Urgency
- Impromptu Meeting with Dawie
- Meeting with Scott: Ending a Day of Confusion
- Partnership Meeting 13 November
- Alfred’s Presence in Langrug
- Realising the Greywater Cleaning Problems
- Working Group’s Apparent Lack of Trust in the Municipality: Putting Together a Report
- Tensions Regarding Community Contributions and the MPC
- Act 4: WaSH Construction
- Act 5: Our Reflections
- Rooftop Gardens for Sustainable Livelihoods in Cape Town
- Supporting Reblocking and Community Development in Mtshini Wam
- Capacity Building of a Community Based Organisation in Maitland Garden Village
- 2011
- Addressing Greywater Management Issues in Langrug Using a Sustainable Reiterative Process
- Black River Corridor: Visions for Restoration and Recreational Use
- Envisioning the Future Development of Oude Molen Eco Village
- Supporting Asset Based Community Development in Maitland Garden Village
- Chapter 1: What is the best way to aid a community in a sustainable and positive way?
- Chapter 2: How does one lay the foundation for a mutually beneficial relationship?
- Chapter 3: What communication tools can be utilised to gauge a community’s aspirations?
- Chapter 4: What is the best way to show gratitude and initiate community driven action?
- Chapter 5: What is the best approach to gain governmental participation in preparation for a community programme?
- Chapter 6: How do you structure a meeting so the attendees become participants and truly invested?
- Chapter 7: How can MGV continue to develop through mutually beneficial relationships with neighbouring communities?
- Epilogue: What does the future hold?
- Acknowledgements
- Team Interviews
- Photo Gallery
- Downloads and References
- Sustainable Livelihoods Through Beekeeping
- WaSHUp: Innovating Water Sanitation and Hygiene Upgrading in Langrug
- Langrug
- Meet the Team
- Water and Sanitation in Langrug
- Mapped Facility 1
- Mapped Facility 10
- Mapped Facility 2
- Mapped Facility 3
- Mapped Facility 4
- Mapped Facility 5
- Mapped Facility 6
- Mapped Facility 7
- Mapped Facility 8
- Mapped Facility 9
- Mapped Facility 11
- Mapped Facility 12
- Mapped Facility 13
- Mapped Facility 14
- Mapped Facility 15
- Mapped Facility 16
- Mapped Facility 17
- Mapped Facility 18
- Mapped Facility 19
- Mapped Facility 20
- Mapped Facility 21
- Partnerships in Langrug: A Model for the Future
- Community-Driven Development
- Community WaSHUp Spaces
- Multi-Purpose WaSHUp Facility
- Future
- Supplemental Material
- 2010
- Profiling Community Assets
- Collaborative Construction
- Stormwater Management
- Strengthening Spaza Shops
- Supporting Early Childhood Development
- Initiation Site Development
- Meet the Team
- Project
- Good Hope Initiation Site Proposal
- Objectives
- Background
- A Historic Perspective of the Initiation Ritual
- Challenges of Initiation
- Limited Physical Space and Lack of Seclusion
- Building and Burning of Initiation Huts
- Challenges of Initiation in an Urban Environment
- Economic Challenges for Initiates
- Health Concerns during the Initiation Process
- Malnutrition during the Seclusion Period
- Psychological Challenges Faced by Initiates
- Conflicts Between Traditional Leaders and Authorities
- Government Actions in the Initiation Community
- Methodology
- Project Resources
- Acknowledgements
- Co-Researchers
- 2009
- Buildings
- Communications
- Economy
- Energy
- Gardens
- Mapping and Planning
- Water & Sanitation
- Accomplishments
- Background
- Current Conditions and Common Practices within Monwabisi Park
- Establishing Collaborations
- Future Testing
- History of Water and Sanitation in South Africa
- Learning by Example: Case Studies
- Meet the Team
- Methodology
- Monwabisi Park as a Model for Redevelopment
- Our Partners
- Project Resources
- The Sanitation Centre
- 2008
- 2007
- Contact Us
- Communications
- WaSH
- First Week Plans
- Pre-Travel Planning
- Interactions
- Meeting Strategies
- Shared Action Learning
- Mission Statement and Objectives
- Methodology
- Ethics
- Interview Planning
- Week One Plan
- Beyond Week One
- Cast of Characters
- Welcome to Langrug
- Key Areas of Focus
- References
- CTPC Context
- Setting the Stage
- Sponsor: Community Organisation Resource Centre
- Sponsor: Department of Integrated Human Settlements
- Cast of Characters
- Project Planning
- References
Scene One: Mapping the Pathway at 44 Wale Street
Backstory:
Maps are vital to our project and they will be used for multiple phases in the pathway vision. Our sponsors have access to two mapping programmes in their office building: ArcView, a GIS software that enables us to export aerial maps that are labeled for our project, and an Integrated Spatial Information System (ISIS) mapping software that allowed us to look at aerial views as well but also obtain information about the property boundaries and owners. Maps will be used for multiple facets of developing our pathway vision: determining how to connect potential pathway routes by viewing desire lines from aerial mapping, determining property boundaries and owners that own and use land that desire lines fall on, and displaying our pathway vision to others.
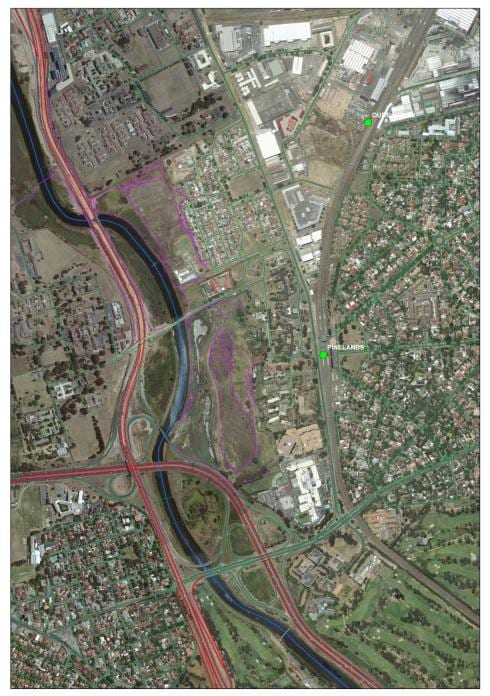
Map of the desire lines (purple) behind MGV and Oude Molen
Cast of Characters:
Shahbaz and Tara contacted our sponsor, Crispin, to ask about going to his office at 44 Wale Street to use the mapping software city officials have available to them. Crispin only had access to ISIS mapping so he asked Damien to lend us his version of ArcView, help us label the map, and print it out for us.
Setting:
We arrived at the City of Cape Town’s 44 Wale Street location and went to the 5th floor to meet Crispin at his desk. Crispin set Shahbaz and Tara up at Damien’s desk because he was out of the office momentarily. Crispin logged into his own account on Damien’s computer so we could begin using the ISIS software that all employees had access to. He explained that ArcView licenses were only given to certain employees because the software is very expensive. Crispin quickly showed us how to perform the basic functions we would need and then returned to his desk. We whispered as we worked in hopes of not disrupting the other 5-6 people in the office. Damien returned just as we finished using the ISIS software and allowed us to use his ArcView programme. Instead of showing us how to use the programme, he stayed seated and asked us what features we wanted to see and then put them on the map for us. We stood around the computer explaining to him how to make the picture how we wanted. After Damien sent the picture to Crispin to print, he had some trouble getting the quality to be enough so that the image was clear. He told us we could leave and he would bring the print and digital copy to our meeting in MGV at 2:00 PM that afternoon.
Connecting:
After our first trip to map at 44 Wale Street, we agreed to make a second trip Thursday with a clearer understanding of what exact maps we wanted to create. Crispin stressed if we did not have a clear idea of the maps we wanted, it would take a long time.
Planning:
What we planned to accomplish during our first meeting was:
- Familiarise ourselves with both ArcView and ISIS programmes
- Determine where desire lines led to
- Map best routes of connection
- Evaluate landowners, rent payers, and use of land
- Get a printed map with visible desire lines so we could map them onto the ArcView software for our next visit
Action/Observation:
We learned a lot in our first visit to 44 Wale Street. By using the first programme, the ISIS software, we were able to see the property lines on the map. These properties had specific ERF numbers. Searching these ERF numbers in the programme shows many features of the property, including its usage, its owner, its ratepayer (who the land is rented to) and its boundaries. This will allow us to see when creating possible connections of the desire lines who we would need to contact about using their land. We will also be able to map alternative routes based on the property boundaries of owners who will let us use their land and those who won’t. We were able to see some of the more defined desire lines, such as those around Oude Molen, on the ISIS maps in comparison to what we could see on the ArcView map. However, the ArcView system was the software that was easier to make digital maps which we could export and print. We were also able to highlight and/or label roads, rivers, train stops, etc., which were helpful tools for orienting someone who is looking at the map. We will also be able to make more labels to further orient a map-viewer of what they are looking at. We will label other things such as the communities themselves and the boundaries of TRUP. Since we were not the ones to manipulate this software, it was a little difficult to get our first map to look precisely how we wanted it. We hope for the second time we go in to map, we will be able to use the software ourselves to generate images exactly how we like them.
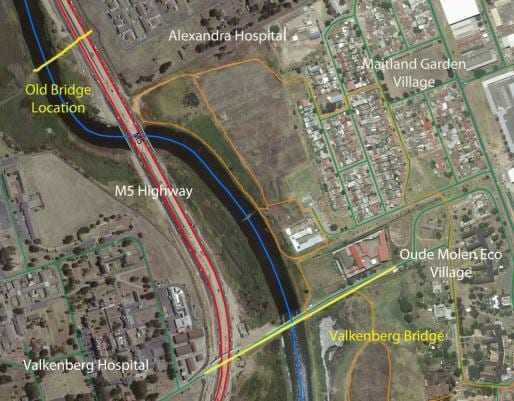
Map of the proposed pathway (orange)
Reflection and Learning:
After our meeting at 44 Wale Street, we were able to show our preliminary version of the map to our advisors and our sponsors. We received many useful suggestions we plan to implement. One suggestion we received from Scott was to use the maps as a table of contents; have a zoomed out map that one can look at particular locations zoomed in where we could somehow visualise what changes we intend to make at locations along the pathway. Megan suggested we outline TRUP and label the communities to orient map-viewers that would not recognise community boundaries from the building orientation. Bob suggested we also make maps with varying levels of detail including some with an aerial view and some without and with varying levels of labeling. Crispin made it clear that for our next mapping meeting, we would need to have a better idea of the features we wished to include in our maps and the scope of each map we wanted to make. Our whole team was receptive to the advice we received because all of these ideas seemed helpful for future planning.
Future Planning:
Plans for Thursday’s mapping meeting:
- Look at maps of TRUP and see which of their map features we want to incorporate in our maps
- Trace desire lines on printed map so that we can put them in the ArcView software Thursday
- Determine scope of our mapping; how many we want, how zoomed in and out we will like our maps to be, what details we want to include in each, etc.
- Evaluate how we can best integrate maps into our proposal