

- Act III Scene I: Adding Color (November 16, 2015)
- Slideshow Test
- “Bawawethu” (December 3, 2015)
- Social Enterprise
- Acronym Dictionary
- Background
- About CTPC
- Blog
- Resource Library
- Welcome!
- Projects
- Projects Overview
- 2015
- Expanding Early Childhood Development Opportunities in an Informal Settlement
- Exploring New Outreach Models for Early Childhood Development
- Fostering Community at the Canterbury Street Lot
- Background Research
- Philosophy Behind Helping the Homeless
- Belonging and its Psychological Impact on Street People
- Establishing Social Inclusion in the Street Community
- Understanding Homelessness’ Role in Urban Development
- Investigating the Effect of Public Spaces on Cities
- Creating a Sense of Community Through Green Areas
- Commemorating the Street Community’s Lives
- Partnerships
- Planning
- Outcomes
- Resources
- Background Research
- Providing More than a Meal at Service Dining Rooms
- Upgrading the K2 Informal Settlement through Community Collaboration
- Background Research
- Planning Pages
- The Partnership
- K2 Journey
- Act I Scene I: New Beginnings (October 22, 2015)
- Act I Scene II: Getting lost in the K2 Maze (October 23, 2015)
- Act I Scene III: The Outsiders (October 26, 2015)
- Act II Scene I: Touring Tuesday (November 10, 2015)
- Act II Scene II: Trouble in K2 (November 16, 2015)
- Act III Scene I: Luncheon: A Change of Scenery (November 17, 2015)
- Act III Scene II: Adding Colour (November 20, 2015)
- Act III Scene III: “Bawawethu” (December 3, 2015)
- Act III Scene IV: Financial Contribution: One Step at a Time (December 7, 2015)
- Project Outcomes
- Project Resources
- References
- Women’s Empowerment through Increased Access and Understanding of Technology
- Background Research
- Partnership
- Planning
- Process Narrative
- Outcomes
- Project Resources
- References
- 2014
- Empowerment through Improving Facilities at the Sizakuyenza Safe House
- The Big Issue Goes Online: Creating a Vendor-Run Profiling Program
- Early Childhood and Community Development in Flamingo Crescent
- Background Research
- Challenges of Early Childhood Development in South Africa
- Crèche Regulations and Finances
- Best Practices for Crèche Development
- Determinants of Crèche Quality
- The Effect of Playground Design on Child Development
- The Effect of Playground Design on Communities
- Developmental Benefits of Recreational Space
- Public Space Inequality in South Africa
- Recyclable Playgrounds
- Flamingo Crescent Informal Settlement
- Planning and Methods
- The Partnership
- The Play by Play
- Project Outcomes
- Resources
- Background Research
- An Entrepreneurial Initiative for Distributing Energy Efficient Products in Low Income Communities
- Background
- Planning
- Partnerships
- Project Narrative
- Act 1: Adapting our Project
- Act 2: Finding Distribution Centers
- Scene 1: Creating Interest in Wonderbags
- Scene 2: First Trip to an Informal Settlement
- Scene 3: Looking for New Products
- Scene 4: Gathering Community Energy and Crèche Information
- Scene 5: A Visit to Flamingo
- Scene 6: Just Do It: Three Crèche Visits
- Scene 7: The Reality of Low Income Areas
- Scene 8: A College for Kiddies
- Act 3: Establishing Pilot Programs
- Scene 1: Pilot Program
- Scene 2: A Second Pilot Program
- Scene 3: Sustainable Sales
- Scene 4: Low Income Energy Services Task Team Meeting
- Scene 5: Lunch at the Crèche
- Scene 6: Exploring Other Products
- Scene 7: Graduation
- Scene 8: Enjoying Electricity
- Scene 9: Collaboration for Future Implementation
- Scene 10: Keep Smiling
- Epilogue
- Outcomes
- References
- Expanding Health, Education, and Wellbeing Services and Analyzing the Effects of Underlying Social Complexities on WaSH-UP
- Background Research
- Mission & Objectives
- Cast of Characters
- Process Narrative: Our Journey
- Project Outcomes: Not Just Toilets Anymore!
- Epilogue
- WaSH-UP Sustainable Livelihoods and Business Operations
- Mission and Objectives Overview
- Background Research
- Informal Settlements in South Africa: Langrug Community
- Shared Action Learning (SAL)
- Community Assets
- What Business Institutions/Models Would Best Serve the Community?
- How to Start a Small Business in Informal Settlements
- Possible Models for Small Businesses and Savings Groups
- Ethical Considerations
- Research Questions
- Sources and References
- The Partnership
- Acts and Scenes
- Project Outcomes
- Reflection and Growth during the IQP Journey
- 2013
- Blue Sky Recycling Programme
- Community Mobilisation Through Reblocking in Flamingo Crescent
- The Partnership
- Welcome to Flamingo Crescent
- Background Research
- Methodology: Shared Action Learning
- Project Narrative
- Act 1: Trial and Error
- Scene 1: First Meeting with Levona
- Scene 2: An Introduction to 7de Laan
- Scene 3: Beginnings of Turmoil
- Scene 4: Finding Hope
- Scene 5: A Motivation for our Work
- Scene 6: Red Hill Settlement Tour Highlights Opportunities
- Scene 7: City Mission Visit Illuminates the Option of Reblocking
- Scene 8: Meeting the Key Planners
- Scene 9: First Weekly Meeting Causes Confusion
- Scene 10: Subcouncil Meeting Eases Worries
- Scene 11: A Raw and Unexpected Story
- Scene 12: Ethiopian Experience
- Scene 13: Shack Demolition
- Scene 14: Engineering the Future
- Scene 15: Public Meeting in 7de Laan
- Act 1 Reflection
- Act 2: Testing the Waters
- Scene 1: A Taste of Flamingo
- Scene 2: Getting to know the Community Leaders
- Scene 3: Cluster Meetings in Flamingo
- Scene 4: Introduction to Mtshini Wam
- Scene 5: Kuku Town Visit Provides Example
- Scene 6: All Parties Come Together
- Scene 7: Library Networking
- Scene 8: Communication and Enumeration
- Act 2 Reflection
- Act 3: Taking Care of Business
- Scene 1: Meeting the Contractors
- Scene 2: Breaking Ground
- Scene 3: If You Build It They Will Come
- Scene 4: Visiting ELRU Opens Doors for a Crèche in Flamingo
- Scene 5: A Living Virtue
- Scene 6: Meeting a New Potential Stakeholder
- Scene 7: Meeting with the CECD: “Let’s do it.”
- Scene 8: Bringing Green Innovation to the Crèche
- Scene 9: Final Stakeholder Meeting
- Scene 10: Saying Goodbye to Flamingo Crescent
- Act 3 Reflection
- Student Reflections
- Act 1: Trial and Error
- Resources and References
- Community Mobilisation Through Reblocking: An Interactive Upgrading Anthology
- Early Childhood Development Connection
- MGV Park Redevelopment
- Project Partners
- Project Outcomes
- Background Research
- Planning and Methods
- Process Narrative
- Act 1: The Beginning
- Scene 1: Arriving in Maitland Garden Village
- Scene 2: First Sight
- Scene 3: Meeting with the Project Members
- Scene 4: Community Survey
- Scene 5: Working with Co-Researchers
- Scene 6: Village Day
- Scene 7: Monday’s Meeting with Jude
- Scene 8: Monday’s Meeting with Co-Researchers
- Scene 9: Discouraging Moment
- Scene 10: Setting up the Fantasy Playscape Activity with the Crèche
- Act 2: A New Hope
- Act 3: Getting the Ball Rolling
- Personal Reflections
- Act 1: The Beginning
- Resources
- WaSH-UP
- 2012
- Capacity Building of a Community Based Organisation in Maitland Garden Village
- Meet the Team
- Background Research and Preparation
- Ethical Considerations
- Cape Town Project Centre Context
- Sponsors
- Project Work on Site
- Cast of Characters
- Meetings
- Organisational Profiles
- Act 1: Finding our Footing
- Scene 1: First Encounter with Maitland Garden Village (MGV)
- Scene 2: Tour of Maitland Garden Village
- Scene 3: Ronell’s Sight into the Help Centre
- Scene 4: First Look at the Potential Venue
- Scene 5: Getting to Know the People We are Working With
- Scene 6: Tour Of Oude Molen
- Scene 7: Village Day
- Scene 8: Monday Morning Meeting
- Scene 9: Meeting at MGV Community Centre
- Reflection and Moving Forward
- Act 2: Building Support
- Act 3: Strategy and Execution
- Envisioning a Black River Pathway: Creating a Heritage Destination through Social Development
- Research & Planning
- Cast of Characters
- Ethical Considerations
- Acts and Scenes
- Act One: Getting Started
- Scene Eight: Maitland Garden Village Day
- Scene Five: Faces of Oude Molen Eco Village
- Scene Four: First Meeting with our Sponsors
- Scene One: The First Pathway Experience
- Scene Seven: Visiting Company’s Garden
- Scene Six: A Presentation to our Sponsors
- Scene Three: Walking the Desire Lines
- Scene Two: Tour of Maitland Garden Village
- Act Two: Developing Relationships
- Act Three: Absorbing Information
- Act Four: Meeting with the City
- Act Five: Wrapping Up
- Act One: Getting Started
- Resources & References
- Laying the Foundation for a Resilient Partnership: Innovative Upgrading in the Informal Settlement of Langrug
- Welcome to Langrug
- Background Research
- Cast of Characters
- Primary Project Focuses
- Acts and Scenes: Our Observations and Reflections
- Act 1: Jumping Right In
- Act 2: Planning and Moving Forward
- Discussing the Needs of the Community and How the MPC Can Help
- Making the Decision to Move Forward with the Multi-Purpose Centre
- Reblocking Guidebook Discussion
- Re-Measuring for Reblocking
- Spacing Out ReBlocking
- Fire In Zwelitsha
- Lunch Scene
- Working Team Arguments
- Playing Games
- Introductions at the Municipality: A Revelation
- Amanda Realises the Importance of Documentation
- The Working Team Presents to the Municipality
- How Simple Office Supplies Can Spark Progress
- Further Difficulty with Planning
- Learning How to Do (and Teach) a Cost Analysis
- Act 3: Making Decisions
- Working Group Expresses Community Urgency
- Impromptu Meeting with Dawie
- Meeting with Scott: Ending a Day of Confusion
- Partnership Meeting 13 November
- Alfred’s Presence in Langrug
- Realising the Greywater Cleaning Problems
- Working Group’s Apparent Lack of Trust in the Municipality: Putting Together a Report
- Tensions Regarding Community Contributions and the MPC
- Act 4: WaSH Construction
- Act 5: Our Reflections
- Rooftop Gardens for Sustainable Livelihoods in Cape Town
- Supporting Reblocking and Community Development in Mtshini Wam
- Capacity Building of a Community Based Organisation in Maitland Garden Village
- 2011
- Addressing Greywater Management Issues in Langrug Using a Sustainable Reiterative Process
- Black River Corridor: Visions for Restoration and Recreational Use
- Envisioning the Future Development of Oude Molen Eco Village
- Supporting Asset Based Community Development in Maitland Garden Village
- Chapter 1: What is the best way to aid a community in a sustainable and positive way?
- Chapter 2: How does one lay the foundation for a mutually beneficial relationship?
- Chapter 3: What communication tools can be utilised to gauge a community’s aspirations?
- Chapter 4: What is the best way to show gratitude and initiate community driven action?
- Chapter 5: What is the best approach to gain governmental participation in preparation for a community programme?
- Chapter 6: How do you structure a meeting so the attendees become participants and truly invested?
- Chapter 7: How can MGV continue to develop through mutually beneficial relationships with neighbouring communities?
- Epilogue: What does the future hold?
- Acknowledgements
- Team Interviews
- Photo Gallery
- Downloads and References
- Sustainable Livelihoods Through Beekeeping
- WaSHUp: Innovating Water Sanitation and Hygiene Upgrading in Langrug
- Langrug
- Meet the Team
- Water and Sanitation in Langrug
- Mapped Facility 1
- Mapped Facility 10
- Mapped Facility 2
- Mapped Facility 3
- Mapped Facility 4
- Mapped Facility 5
- Mapped Facility 6
- Mapped Facility 7
- Mapped Facility 8
- Mapped Facility 9
- Mapped Facility 11
- Mapped Facility 12
- Mapped Facility 13
- Mapped Facility 14
- Mapped Facility 15
- Mapped Facility 16
- Mapped Facility 17
- Mapped Facility 18
- Mapped Facility 19
- Mapped Facility 20
- Mapped Facility 21
- Partnerships in Langrug: A Model for the Future
- Community-Driven Development
- Community WaSHUp Spaces
- Multi-Purpose WaSHUp Facility
- Future
- Supplemental Material
- 2010
- Profiling Community Assets
- Collaborative Construction
- Stormwater Management
- Strengthening Spaza Shops
- Supporting Early Childhood Development
- Initiation Site Development
- Meet the Team
- Project
- Good Hope Initiation Site Proposal
- Objectives
- Background
- A Historic Perspective of the Initiation Ritual
- Challenges of Initiation
- Limited Physical Space and Lack of Seclusion
- Building and Burning of Initiation Huts
- Challenges of Initiation in an Urban Environment
- Economic Challenges for Initiates
- Health Concerns during the Initiation Process
- Malnutrition during the Seclusion Period
- Psychological Challenges Faced by Initiates
- Conflicts Between Traditional Leaders and Authorities
- Government Actions in the Initiation Community
- Methodology
- Project Resources
- Acknowledgements
- Co-Researchers
- 2009
- Buildings
- Communications
- Economy
- Energy
- Gardens
- Mapping and Planning
- Water & Sanitation
- Accomplishments
- Background
- Current Conditions and Common Practices within Monwabisi Park
- Establishing Collaborations
- Future Testing
- History of Water and Sanitation in South Africa
- Learning by Example: Case Studies
- Meet the Team
- Methodology
- Monwabisi Park as a Model for Redevelopment
- Our Partners
- Project Resources
- The Sanitation Centre
- 2008
- 2007
- Contact Us
- Communications
- WaSH
- First Week Plans
- Pre-Travel Planning
- Interactions
- Meeting Strategies
- Shared Action Learning
- Mission Statement and Objectives
- Methodology
- Ethics
- Interview Planning
- Week One Plan
- Beyond Week One
- Cast of Characters
- Welcome to Langrug
- Key Areas of Focus
- References
- CTPC Context
- Setting the Stage
- Sponsor: Community Organisation Resource Centre
- Sponsor: Department of Integrated Human Settlements
- Cast of Characters
- Project Planning
- References
Identifying Flooding Hot Spots Method
Identifying Flooding Hot Spots: (Return to “Mission and Philosophy”)
On the first day of work in Monwabisi Park, we, the stormwater management team, accompanied by co-researchers, walked along the two pilot roads designated by the VPUU: one within B-section and another within C-section. For the first week, we conducted preliminary interviews with people who lived on both roads, focusing on the effects of stormwater during heavy rain periods. Based on the resident responses, and with the direction of Dr. Kevin Winter, we concluded that the pilot road in C-section (Figure 1.1) had a greater need for the implementation of a stormwater management system, as more residents experienced greater amounts of flooding along that road. The C-Section road started at the main road, Mew Way, and ended by the VPUU kick-about (soccer field).

Figure 1.1: C-Section Road
We walked along the C-section road again, this time with Dr. Winter, and focused on the various conditions of the road. These conditions included the topography and composition of the road, density of houses on either side of the road, path of the road, which included the bends and key side roads, and lastly, the existing stormwater interventions. The topography of the road varied significantly in different sections, with gradients differing by a few meters, which created valleys that contributed to the pooling of stormwater. The road was mostly made up of sand with rocks embedded in it, and as we had learned throughout our previous research, in environments such as this, sand tends to move around and shift easily to create divots, causing unfavorable road conditions. As seen in the map (Figure 1.1), the road has one major bend about 50 meters from the start of the road, putting the shacks in that area at a higher risk for flooding.
Using these conditions, Dr. Winter and ourselves identified seventeen different spots on the road that could potentially have been affected by stormwater. Using a portable Global Positioning System (GPS), we marked these spots on a map obtained from a software program, Google Earth, and used them as a guideline to interview residents of these areas. We conducted a more formal interview composed of questions we had prepared which helped to pinpoint problems focused specifically on flooding. At the end of the week, we decided to narrow down the number of hot spots to four major hot spots that experienced the greatest amount of flooding and showed the greatest potential for improvement (Figure 1.2).
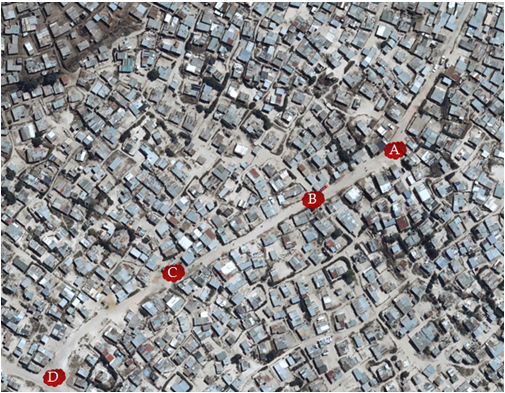
Figure 1.2: Identified Hot Spots
Hot spot A is located at the bend in the road (Figure 1.2), and experiences flooding due to the downhill slope and the uneven surface of the ground. The houses located directly on the bend of the road experience flooding because the water flows directly towards them. Hot spot B is located at a valley in the road where both sides of the road slope down into a low-lying area surrounded by houses at the bottom. This causes stormwater to flow directly into the houses and pool at the very bottom of the hills. Hot spot C is located at the bottom of a downhill slope, but the major problem in this area is the flow of greywater created by the toilets and communal water tap. The stormwater mixes with the greywater and creates unfavorable conditions for the residents who live in this region. Hot Spot D is located at the end of the road, which is also at the base of a downhill slope. This section is very important because there is an area behind the houses that could potentially be used as a location for a wetland. Analysis of these different hot spots assisted us in determining appropriate stormwater management solutions for these areas that we can also suggest to be used in other regions of Monwabisi Park that are comprised of similar conditions.